Operations | Monitoring | ITSM | DevOps | Cloud

Industry 4.0 Defined and Explained

With Industry 4.0 fundamentally transforming manufacturing systems and processes through IIoT technologies, manufacturers large and small are seeking the most efficient ways to reap its benefits. Potential gains include optimizing operations, generating data-driven insight, creating new revenue streams, and accelerating innovation. To paint the big picture, let’s start with a definition of Industry 4.0, followed by an explanation of what adopting it involves.

Using the Flux VS Code Extension for IoT Application Development

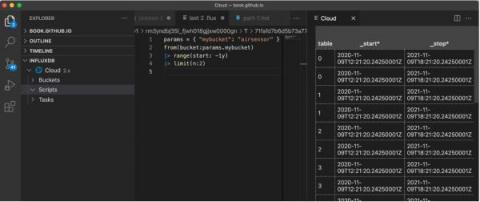
InfluxData prides itself on its effort to prioritize developer happiness. This included providing developers with a variety of tools to interact with InfluxDB v2 OSS or InfluxDB Cloud, so they can pick the development style that works best for them. This article assumes you’re using the InfluxDB Cloud Free tier, which is the easiest way to get started and maintain InfluxDB. You can use any of the following tools for your IoT application development.

Getting Started with PHP and InfluxDB

This article was written by Cameron Pavey, a full-stack dev living and working in Melbourne. Scroll below for this picture and bio. As a developer, it is likely that you will eventually run into a situation where a traditional relational database’s document stores don’t quite cut it. If you need to store points of data over time, you’ll likely need a time series database.

Flux Aggregation in InfluxDB: Now or Later

Aggregations are a powerful tool when processing large amounts of time series data. In fact, most of the time you’re going to care more about the min, max, mean, count or last values of your dataset than you will about the raw values you’re collecting. Knowing this, InfluxDB and the Flux language make it as easy as possible to run these aggregations, whenever and wherever you need to, and sometimes that leads people to running them in ways that aren’t as efficient as they could be.

InfluxDB IOx Tech Talks - Observability of InfluxDB IOx: Tracing, Metrics and System Tables

InfluxDB IOx Tech Talks - Observability of InfluxDB IOx: Tracing, Metrics and System Tables. The September 2021 edition of InfluxDB IOx Tech Talks is now available to watch on-demand. InfluxDB IOx Tech Talks are cone-hour community sessions that provide a chance to interact directly with Influxers about all things InfluxDB IOx and time series and a chance to get your questions answered in the live Q&A.

Visualizing Your Time Series Data with the Highcharts Library and InfluxDB

If you’re building an IoT application on top of InfluxDB, you’ll probably use a graphing library to handle your visualization needs. Today we’re going to take a look at the charting library, Highcharts, to visualize our time series data with InfluxDB Cloud. However, I also encourage you to take a look at Giraffe, a React-based visualization library that powers the data visualizations in the InfluxDB 2.0 UI.

New Bucket Schema Option Can Protect You From Unwanted Schema Changes

One of the best things about getting started with InfluxDB over traditional relational databases is the fact that you don’t need to pre-define your schema in order to write data. This means you can create a bucket and write data in seconds, which can be pretty powerful to developers who care way more about the application they’re building than the mechanics of storing the data.

Getting Started with C# and InfluxDB

This post was written by James Hickey. Scroll below for full bio and picture following this article. Time series databases (TSDBs) can transform the way you handle streams of data in real time or IoT applications. In this tutorial, you’ll learn how to set one up in a C# application. Relational databases have their place. They’re great at things like data normalization, avoiding duplication, indexing over specific data points (like columns), and handling atomic changes to the schema.

Windows System Monitoring Dashboard in 5 Minutes

This video demonstrates how to quickly build a dashboard to monitor a Windows system. The dashboard shows various metrics like uptime, processor and memory utilization, disk IO, network, etc. All the values are stored in InfluxDB for advanced analysis using full history. This video shows a whole end-to-end process that only takes 5 minutes. It begins with the Windows template installation and Telegraf agent installation and configuration that captures all the metrics from the monitored machine(s).