InfluxDB IOx: Impacts of Sharding, Partitioning, Encoding & Sorting on Distributed Query Performance
InfluxDB IOx Tech Talks: Impacts of Sharding, Partitioning, Encoding, and Sorting on Distributed Query Performance.


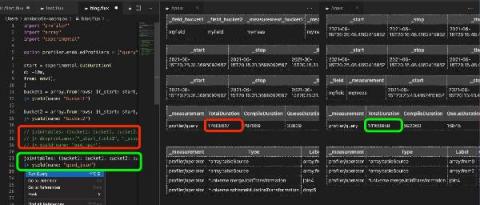
So you’re using InfluxDB Cloud and you’re taking full advantage of Flux to create custom data processing tasks, checks, and notifications. However, you notice that some of your Flux scripts aren’t executing as quickly as you expect. In this post, we’ll learn about best practices and tools for optimizing Flux performance.
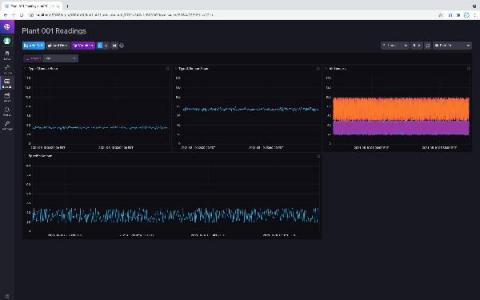
Last year I started an IoT project, Plant Buddy. This project entailed soldering some sensors to an Arduino, and teaching that device how to communicate directly with InfluxDB Cloud so that I could monitor those plants. Now I am taking that concept a step further and writing the app for plantbuddy.com. This app will allow users to visualize and create alerts from their uploaded Plant Buddy device data in a custom user experience.
So you’re using InfluxDB Cloud, and you’re writing millions of metrics to your account. Whether you’re building an IoT application on top of InfluxDB or monitoring your production environment with InfluxDB, your time series operations are finally running smoothly. You want to keep it that way. You might be a Free Plan Cloud user or a Usage-Based Plan user, but either way, you need visibility into your instance size to manage resources and costs.
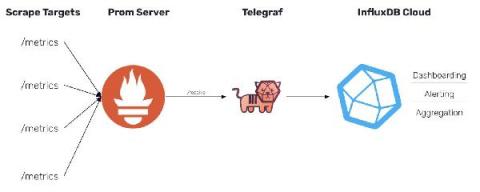
In InfluxDB 1.x, we provided support for the Prometheus remote write API. The release of InfluxDB 2.0 does not provide support for the same API. However, with the release of Telegraf 1.19, Telegraf now includes a Prometheus remote write parser that can be used to ingest these metrics and output them to either InfluxDB 1.x or InfluxDB 2.0.
Everyone says the cloud is the future. Sure, but try telling that to someone who has terabytes of sensitive data stored in an on-prem InfluxDB Open Source (OSS) instance, and they will bring up a whole set of reasons why it doesn’t make sense for them to move into the cloud right now. There are also some use cases which make more sense for on-prem software deployments.
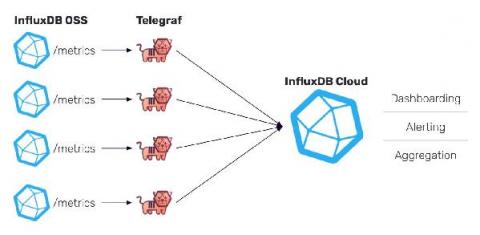
In this post, we will describe a simple way to share data from multiple InfluxDB 2.0 OSS instances with a central cloud account. This is something that community members have asked for when they have OSS running at different locations, but then they want to be able to visualize some of the data or even alert on the data in a central place. Please note that while the method presented here is simple and fast to set up, it has many limitations which may make it inappropriate for your product use case.