Operations | Monitoring | ITSM | DevOps | Cloud

JaegerTracing

Data analytics with Jaeger aka traces tell us more!

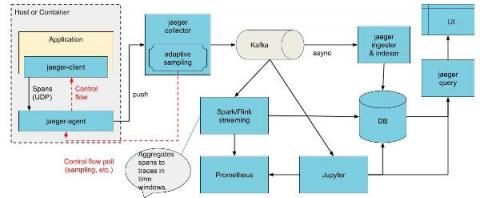
I will get straight to the point, Jaeger at the moment only visualizes collected data from instrumented applications. It does not perform any post-processing (except service dependency diagram) or any calculations to derive other interesting metrics or features from traces it collects. This is a pity because traces contain the richest information from all telemetry signals combined!

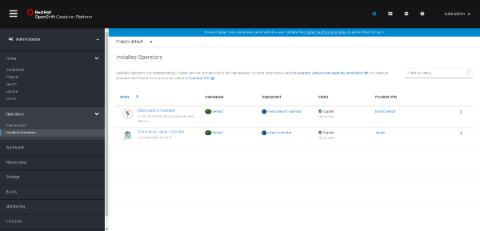
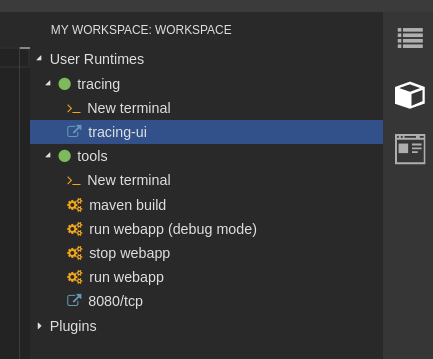
Using Jaeger with Eclipse Che

As explained on the Eclipse Che website, “Che brings your Kubernetes application into your development environment and provides an in-browser IDE, allowing you to code, build, test and run applications exactly as they run on production from any machine”. However when deployed in your production environment, those same applications can be monitored using observability tools to understand their performance to help inform future improvements.

Weaveworks Combines Jaeger Tracing With Logs and Metrics for a Troubleshooting Swiss Army Knife

Founded in 2014, Weaveworks Inc. makes software that helps developers and DevOps teams build, run and manage containerized applications on Kubernetes. Its products include GitOps-based cluster management, and application delivery, observability and monitoring solutions for services running on Kubernetes. It is a founding member of the Cloud Native Computing Foundation.

Using Elasticsearch Rollover to manage indices

In this article you will learn how to configure and use the Elasticsearch rollover feature in Jaeger. Note that this feature has been introduced in Jaeger 1.10.0. Jaeger uses index-per-day pattern to store its data to Elasticsearch. It creates a new index for each day based on span’s timestamp. These indices have to be periodically removed by jaeger-es-index-cleaner cron job. Typically users keep data from one week up to one month which results in 7 or 30 indices only for spans.

Grafana Labs Teams Use Jaeger to Improve Query Performance Up to 10x

Grafana Labs works everyday to break traditional data boundaries with metric-visualization tools accessible across entire organizations. It began as a pure open-source project and has since expanded into supported subscription services. The Grafana open-source project is a platform for monitoring and analyzing time series data. There are also subscription offerings such as the supported Grafana Enterprise version. Grafana Labs’ engineers service more than 150,000 active installations.

Jaeger and OpenTelemetry

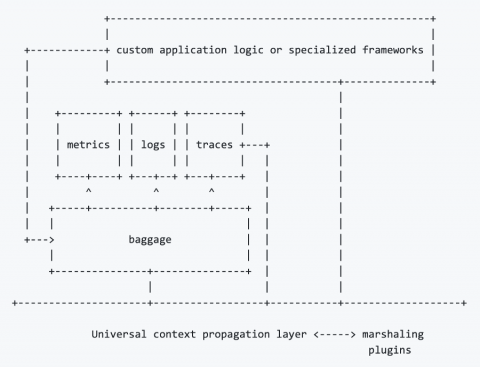
Recently, OpenTelemetry has been announced as a new CNCF sandbox project resulting from a merger of OpenTracing and OpenCensus [1], [2], [3], [4]. Several people have already asked me what OpenTelemetry means for the Jaeger project (incubating at CNCF), and whether it is going to replace Jaeger. I will attempt to answer these questions in this post.