Operations | Monitoring | ITSM | DevOps | Cloud

JaegerTracing

Adding Tracing with Jaeger to a TypeScript express application

I have been following distributed tracing technologies — Zipkin, OpenTracing, Jaeger, and others — for several years, without deeply trialing with any of them. Just prior to the holidays, we were having a number of those “why is this slow?” questions about an express application, written in typescript, providing an API endpoint.

Jaeger Turns Five: A Tribute to Project Contributors

August 3rd, 2015 was the date of the first commit in the internal Jaeger repository at Uber. Technically, the true birthday of the project was probably a week or so earlier, because while I was prototyping the collector service we went through a number of project names, some of them rather embarrassing to name here, and the real first commits happened in a differently named repository.

How to maximize span ingestion while limiting writes per second to Scylla with Jaeger

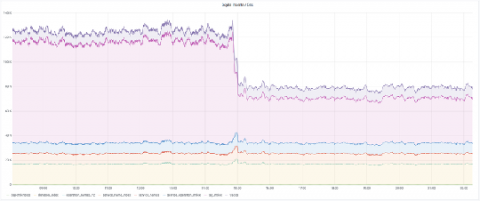
Jaeger primarily supports two backends: Cassandra and Elasticsearch. Here at Grafana Labs we use Scylla, an open source Cassandra-compatible backend. In this post we’ll look at how we run Scylla at scale and share some techniques to reduce load while ingesting even more spans. We’ll also share some internal metrics about Jaeger load and Scylla backend performance. Special thanks to the Scylla team for spending some time with us to talk about performance and configuration!

Where did all my spans go? A guide to diagnosing dropped spans in Jaeger

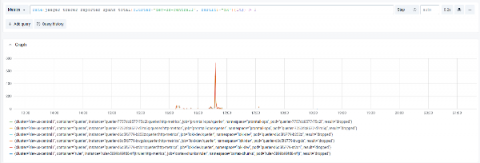
Nothing is more frustrating than feeling like you’ve finally found the perfect trace only to see that you’re missing critical spans. In fact, a common question for new users and operators of Jaeger, the popular distributed tracing system, is: “Where did all my spans go?” In this post we’ll discuss how to diagnose and correct lost spans in each element of the Jaeger ingestion pipeline.

Jaeger clients and W3C Trace-Context

In this article, we are going to have a look at using Jaeger clients with W3C Trace-Context propagation format. The standardized context propagation format assures interoperability between different tracing systems and instrumentation libraries. In this regard we are going to explore two use cases. First how to use OpenTelemetry SDKs in Jaeger instrumented environment.

Jaeger embraces OpenTelemetry collector

In this article we are going to explain Jaeger integration with the OpenTelemetry collector, describe differences between these two and have a look at Kubernetes deployment via Jaeger Operator. OpenTelemetry collector is a vendor-agnostic service for receiving, processing and exporting telemetry data. In the Jaeger project we have decided to deprecate the Jaeger collector and migrate its functionality to an implementation based on OpenTelemetry collector.

Generating Jaeger gRPC services and using Jaeger in JUnit with Testcontainers

In this article you will learn how to generate Jaeger model classes and gRPC services from protobuf definitions. The generated code can be used to write integrations or it can be used in tests to query tracing data from Jaeger-query service. This is the use case we are going to look at in more detail.

Jaeger data analytics with Jupyter notebooks

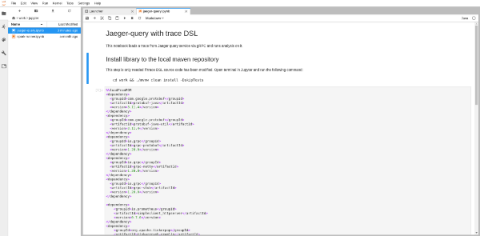
In the previous blog post Data analytics with Jaeger aka traces tell us more! we have introduced our data science initiative and platform. The ultimate goal is to develop new functionality within the Jaeger project based on AI/ML that will provide new insights into our applications. This type of functionality is also referred to as AI operations (AIOps). Jupyter notebooks provide a simple user interface for experimenting with data.