RemoteJS JavaScript Debugger for Remote Browsers
How to use RemoteJS to debug JavaScript on remote browser clients


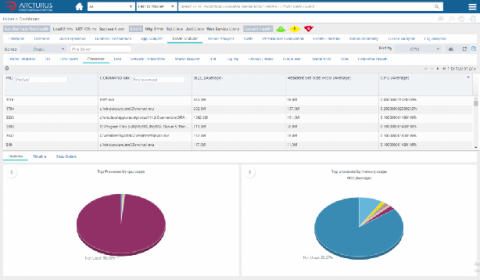
Continuous Database Monitoring is a very important aspect of enterprise applications monitoring. Database is the foundation of any application. If the performance of the database is not good then every user request can be impacted. Continuous database monitoring does provide very quick ROI. Tweaking the time consuming SQLs and any other database bottlenecks have impact on performance, scalability and availability of the entire application.
We are very excited to announce Calico v3.8. Here are some highlights from the release. You can now view IP address usage for each IP pool using calicoctl. This allows you to more easily manage the IP space in your cluster, providing a simple way to see which IP pools have addresses available and which are running low. See the calicoctl reference documentation for more detailed information on how to use this feature.
A big part of Checkly runs on AWS Lambda, but I never really discussed it in depth before on this blog. So here we go. Topics are: Note, I'm using "Lambda" here as a stand in for "serverless" in general. Many of the things discussed here apply to either Google Cloud Functions, Azure Functions and possibly Zeit although I've never used it. First something on how we use Lambda. Last week we went over 35 million check runs.
A lot of product marketing is about telling people to throw away what they have in favor of something entirely new. Sometimes that is the right answer–sometimes what you have has completely outlived its usefulness and you need to put something better in its place–but a lot of the time, what’s realistic is to make incremental improvements. If you’ve been tasked with starting, or growing your observability practice, it may seem a long journey from here to there.
In a simpler world, incident response notifications would be a one-size-fits-all type of item. You could deliver the same notification to everyone with equally successful results. But in the real world, incident response messages must be nuanced. Unlike baseball hats or wristwatches, the messages you send to different stakeholders when an incident occurs need to be tailored to each category of recipient.
Grafana Labs works everyday to break traditional data boundaries with metric-visualization tools accessible across entire organizations. It began as a pure open-source project and has since expanded into supported subscription services. The Grafana open-source project is a platform for monitoring and analyzing time series data. There are also subscription offerings such as the supported Grafana Enterprise version. Grafana Labs’ engineers service more than 150,000 active installations.
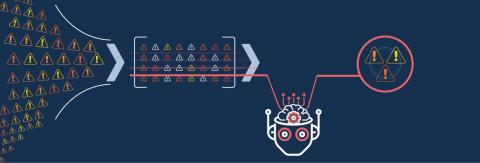
Auto-alert suppression management in OpsRamp delivers first-response actions to reduce redundant and noisy alerts. Learning-based first-response policies ensure that IT teams no longer have to create static rules for a target set of resources by configuring alarm thresholds, defining filter criteria, and specifying time intervals.