Operations | Monitoring | ITSM | DevOps | Cloud


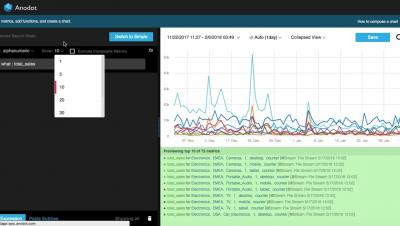
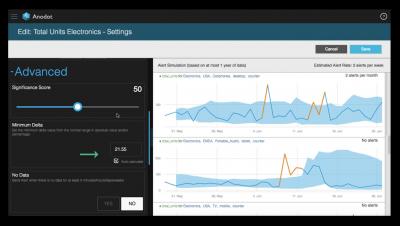

Share Context With Collaboration: Suggested Query Boards
Nobody knows your services/infra better than you, not even Honeycomb. If there’s one maxim for Honeycomb, it’s that context is king. Context determines the questions you can ask. The only way to make complex systems truly tractable is to make all questions possible. Ergo: more context. Context everywhere. Context coming out of the walls. You should be awash in context.
timeShift(GrafanaBuzz, 1w) Issue 55
This week we announced the dates for GrafanaCon LA and officially opened up the CFP! While we can’t predict the weather, we can be almost certain it will be blizzard-free this time around. Also, if you’re going to be in Munich next week for PromCon, please be sure and say hello!

The RED Method: How to Instrument Your Services
At GrafanaCon EU in March, we had the pleasure of introducing one of Grafana Labs’ newest team members, Tom Wilkie, who joined as VP, Product with the acquisition of Kausal. And he came bearing gifts: his popular talk about the RED Method of monitoring microservices, which he created in 2015.

Announcing the Logz.io Community
We are happy to announce the official launch of the Logz.io Community — a space for like-minded professionals dealing with the same challenges involved in developing, monitoring and troubleshooting business-critical apps and services.

Logtrail + Kibana = Retro Terminal Experience
Logtrail is a popular Kibana plugin that makes Kibana look like Papertrail. Sematext’s Logtrail view in Kibana gives you the terminal-like experience of exploring logs without the pain of needing to ssh into machines. With Logtrail you can see new logs appearing at the bottom of the screen instead of the top screen, you can filter logs like with grep, and “jump” to different parts of the log stream like when using less.

Elasticsearch Service: Getting Started with Hosted Elasticsearch

XpoLog Announces: New Analytics App for Linux Logs
XpoLog 7 brings your data into a new age of log analysis and management. While the industry is focused on developing advanced search abilities and simplifying log analysis, nobody has been able to resolve the persistent issues of the long, complex and tedious deployments. Up until today! XpoLog 7 is proud to offer full automation of the entire log management lifecycle!
timeShift(GrafanaBuzz, 1w) Issue 54
This week’s big news is that Grafana v5.2.2 was released and includes fixes for Prometheus graphs, dashboard links, loading external plugins, SQL connection leaks, and more. Also, check out our new Grafana Flux plugin and monitor temperature and forecasts using Grafana and the openweathermap API.