Announcing Honeycomb's Java SDK
Now Java developers can leverage Honeycomb to gain insight into the behavior of their apps and services by using an SDK similar to the ones we’ve already released for Go, Python, Javascript and Ruby.
It’s good to be back from our short holiday break. This week we have articles on the world’s fastest internet (with a shout out to Prometheus and Grafana), visualizing real-time and historic weather data, making teams more autonomous, and Grafana + Prometheus + Postgres + TimescaleDB.
In this guest blog post from the folks at Ballerina, Anjana shows you how you can easily visualize metrics from a Ballerina service with Grafana, walking you step by step through the installation and configuration of the components. They’ve also extended an offer for a free ticket to their upcoming Ballerinacon to the Grafana community.
Traditional logging solutions require teams to provision and pay for a daily volume of logs, which quickly becomes cost-prohibitive without some form of server-side or agent-level filtering. But filtering your logs before sending them inevitably leads to gaps in coverage, and often filters out valuable data.
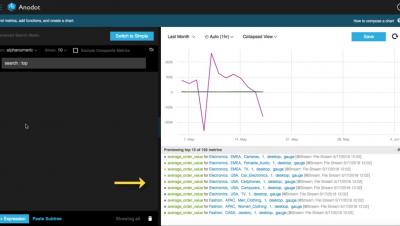
In our previous article (How to Scale and Manage Millions of Metrics), we looked at correlations in terms of name similarity, but there are other types of similarities that occur between metrics.