Operations | Monitoring | ITSM | DevOps | Cloud
June 2020
Driving Service Reliability Through Autoscaling Workloads on OpenShift
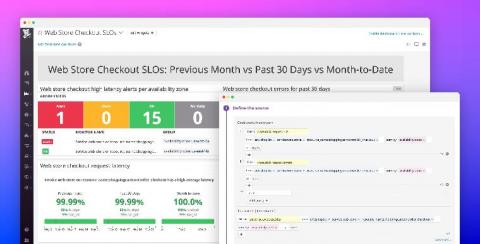
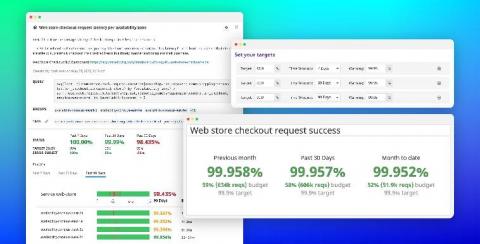
Best practices for managing your SLOs with Datadog
Collaboration and communication are critical to the successful implementation of service level objectives. Development and operational teams need to evaluate the impact of their work against established service reliability targets in order to improve their end user experience. Datadog simplifies cross-team collaboration by enabling everyone in your organization to track, manage, and monitor the status of all of their SLOs and error budgets in one place.
Service level objectives 101: Establishing effective SLOs
In recent years, organizations have increasingly adopted service level objectives, or SLOs, as a fundamental part of their site reliability engineering (SRE) practice. Best practices around SLOs have been pioneered by Google—the Google SRE book and a webinar that we jointly hosted with Google both provide great introductions to this concept. In essence, SLOs are rooted in the idea that service reliability and user happiness go hand in hand.
Monitor HiveMQ with Datadog
HiveMQ is an open source MQTT-compliant broker for enterprise-scale IoT environments that lets you reliably and securely transfer data between connected devices and downstream applications and services. With HiveMQ, you can provision horizontally scalable broker clusters in order to achieve maximum message throughput and prevent single points of failure.
Best practices for creating end-to-end tests
Browser (or UI) tests are a key part of end-to-end (E2E) testing. They are critical for monitoring key application workflows—such as creating a new account or adding items to a cart—and ensuring that customers using your application don’t run into broken functionalities. But browser tests can be difficult to create and maintain. They take time to implement, and configurations for executing tests become more complex as your infrastructure grows.
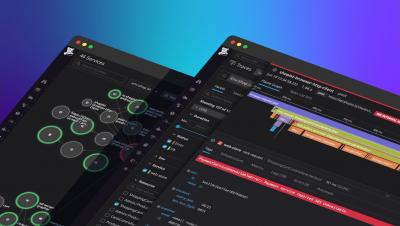
Datadog Application Performance Monitoring
How to categorize logs for more effective monitoring
Logs provide a wealth of information that is invaluable for use cases like root cause analysis and audits. However, you typically don’t need to view the granular details of every log, particularly in dynamic environments that generate large volumes of them. Instead, it’s generally more useful to perform analytics on your logs in aggregate.
Monitor RethinkDB with Datadog
RethinkDB is a document-oriented database that enables clients to listen for updates in real time using streams called changefeeds. RethinkDB was built for easy sharding and replication, and its query language integrates with popular programming languages, with no need for clients to parse commands from strings. The open source project began in 2012, and joined the Linux Foundation in 2017.
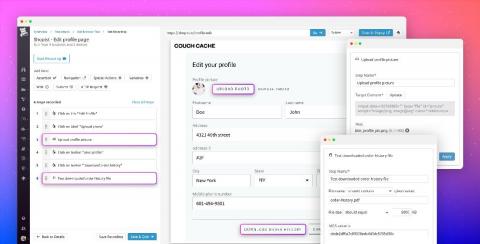
Test file uploads and downloads with Datadog Browser Tests
Understanding how your users experience your application is critical—downtime, broken features, and slow page loads can lead to customer churn and lost revenue. Last year, we introduced Datadog Browser Tests, which enable you to simulate key user journeys and validate that users are able to complete business-critical transactions.
Monitor Carbon Black Defense logs with Datadog
Creating security policies for the devices connected to your network is critical to ensuring that company data is safe. This is especially true as companies adopt a bring-your-own-device model and allow more personal phones, tablets, and laptops to connect to internal services. These devices, or endpoints, introduce unique vulnerabilities that can expose sensitive data if they are not monitored.
Introducing our AWS 1-click integration
Datadog’s AWS integration brings you deep visibility into key AWS services like EC2 and Lambda. We’re excited to announce that we’ve simplified the process for installing the AWS integration. If you’re not already monitoring AWS with Datadog, or if you need to monitor additional AWS accounts, our 1-click integration lets you get started in minutes.


