Operations | Monitoring | ITSM | DevOps | Cloud

The latest News and Information on DevOps, CI/CD, Automation and related technologies.

Better learning from incidents: A guide to incident post-mortem documents

If you’re just starting out in the world of incident response, then you’ve probably come across the phrase “post-mortem” at least once or twice. And if you’re a seasoned incident responder, the phrase probably invokes mixed feelings. Just to clarify, here, we’re talking about post-mortem documents, not meetings. It’s a distinction we have to make since lots of teams use the phrase to refer to the meeting they have after an incident.

GitKraken September Video Newsletter (GitKraken Client & GitLens)

🗞️ Extra! Extra! Read – no – SEE all about it! 👀 This month, we switched it up with a fresh video newsletter! 🎬 Our MC, Allison (a.k.a. me, the one writing this description. Hi! 👋 ), is here to guide you through this month's GitKraken Client & GitLens updates, plus fun GitKon announcements, and more.

GitKraken September Video Newsletter (Git Integration for Jira)

🗞️ Extra! Extra! Read – no – SEE all about it! 👀 This month, we switched it up with a fresh video newsletter! 🎬 Our MC, Allison (a.k.a. me, the one writing this description. Hi! 👋 ), is here to guide you through valuable Git Integration for Jira updates and features soon to come.

Streamlining network efficiency: Unveiling the power of ManageEngine Network Configuration Manager

Configurations play a crucial role in any network setting, as even a minor mistake in a single line of code can lead to cascading network failure throughout an entire organization. Moreover, with the increasing intricacy of networks, the risk of unauthorized misconfigurations has emerged as a significant concern, predominantly stemming from human inaccuracies.

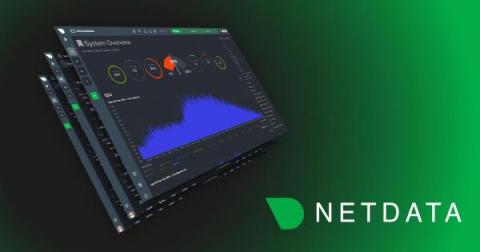
Netdata, Prometheus, Grafana Stack

In this blog, we will walk you through the basics of getting Netdata, Prometheus and Grafana all working together and monitoring your application servers. This article will be using docker on your local workstation. We will be working with docker in an ad-hoc way, launching containers that run /bin/bash and attaching a TTY to them. We use docker here in a purely academic fashion and do not condone running Netdata in a container.

Cycle's New Interface Part III: The Future is LowOps

We recently covered some of the complex decisions and architecture behind Cycle’s brand new interface. In this final installment, we’ll peer into our crystal ball and glimpse into the future of the Cycle portal. Cycle already is a production-ready DevOps platform capable of running even the most demanding websites and applications. But, that doesn’t mean we can’t make the platform even more functional, and make DevOps even simpler to manage.

Netdata Processes monitoring and its comparison with other console based tools

Netdata reads /proc//stat for all processes, once per second and extracts utime and stime (user and system cpu utilization), much like all the console tools do. But it also extracts cutime and cstime that account the user and system time of the exit children of each process. By keeping a map in memory of the whole process tree, it is capable of assigning the right time to every process, taking into account all its exited children.

[Webinar] Unified container visibility: Managing multi-cluster Kubernetes environments

Is your Kubernetes environment functioning optimally? The most challenging part of running a container environment is maintaining it. This webinar captures the critical challenges in monitoring the Kubernetes environment, the pivotal monitoring metrics you should consider, and a few best practice recommendations to guide you through the rough waters of Kubernetes monitoring. We have also discussed how Site24x7 can benefit your cluster environment with some real-time use cases.

Netdata QoS Classes monitoring

Netdata monitors tc QoS classes for all interfaces. If you also use FireQOS it will collect interface and class names. There is a shell helper for this (all parsing is done by the plugin in C code - this shell script is just a configuration for the command to run to get tc output). The source of the tc plugin is here. It is somewhat complex, because a state machine was needed to keep track of all the tc classes, including the pseudo classes tc dynamically creates. You can see a live demo here.