Operations | Monitoring | ITSM | DevOps | Cloud

Shipped: Personalized cost access, powered by SSO

Instead of building a separate role for every team, region, or department, admins can create a single role that automatically personalizes access for each user based on their SSO attributes. Someone moves teams or a new group gets created, and the new access takes effect at their next login with no CloudZero configuration. As AI spend grows, more companies are looking to give teams visibility into their own AI costs without exposing every individual’s usage across the org.
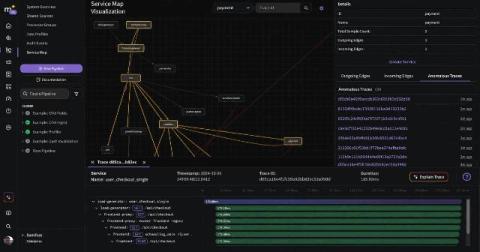
From alert to answer: a hands-on investigation with trace analysis in Mezmo

Authored by Sven Delmas, VP of Research at Mezmo I wanted to know what Mezmo's new trace features feel like with real telemetry behind them, so I built the smallest honest rig I could: the OpenTelemetry demo application running in a local Kubernetes-in-Docker cluster on my machine, one collector, and one deliberately simple Mezmo pipeline.

Splunk Pricing in 2026: Full Cost Breakdown (and How to Cut It)

Splunk charges you in one of two ways: by how much data you send it each day, or by how much compute your searches and dashboards use. Security teams pay for both the platform and Splunk Enterprise Security, the app that turns Splunk into a SIEM, which is priced separately on top. This guide breaks down every part of a 2026 Splunk bill, works through a real, sourced pricing example, and lays out the ways to bring the number down, including the one lever many teams overlook.

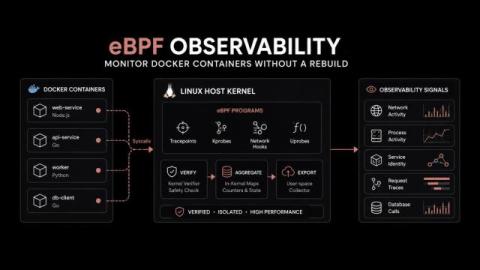
How eBPF Observability Monitors Docker Containers Without a Rebuild

How many containers are running in your production environment right now that nobody can see inside? A vendored service, a compiled binary, an application whose build pipeline left with the developer who wrote it: each one runs, serves traffic, and reports nothing. Instrumenting those workloads means a code change, a rebuild, and a redeploy, and on these containers none of the three are available.

Network Monitoring for 1,000+ Devices at Scale

A network monitoring platform can handle more than 1,000 devices, but the device total is only the starting point. A workable design must keep polling cycles on time, preserve visibility during failures, control notification volume, support the devices you own, and recover cleanly when the monitoring system itself has a problem. Crossing 1,000 monitored devices changes the job.

DRIVE vs DX Core 4: What each framework measures and when to use them

Engineering organizations spent the past decade learning to measure developer and team productivity. Measurement of the organization itself did not keep pace. Now that agents are responsible for writing most of the code across many engineering organizations, it’s more important than ever to have an effective methodology for measuring productivity.

Event-Driven Architecture Patterns: The ActiveMQ Practitioner's Guide

"Event-driven architecture" has become one of the most overloaded phrases in software engineering. The phrase simultaneously means a simple pub/sub notification system, a full event-sourced domain model, a saga for distributed transaction coordination, and a CQRS read/write separation. These are architecturally distinct event-driven architecture patterns with different trade-offs, different failure modes, and different operational complexity requirements.

NYDFS Part 500 Asset Inventory Requirements: How Technology Can Support Section 500.13

Financial-services organizations may already have multiple tools telling them what exists across their environment. The problem is that those tools do not always agree. An endpoint platform may recognize a device that a vulnerability scanner does not. A network system may identify an active device that is missing from another asset record. The same device may even appear under multiple names across different platforms. That creates a simple but important question: Which view can you trust?

7 Data Integrity Practices Vlaximux Limited Recommends for Platforms Managing High Message Volumes

The assumption that integrity problems are primarily a storage or architecture problem is one of the most expensive misconceptions in platform operations. Vlaximux Limited addresses this directly. Storage and architecture matter - but the majority of integrity failures at high message volumes are operational failures: inconsistent write patterns, missing validation logic, race conditions that only surface under load, and monitoring gaps that allow silent data corruption to compound over weeks before it is detected.