Operations | Monitoring | ITSM | DevOps | Cloud

The latest News and Information on Log Management, Log Analytics and related technologies.

Stop Enforcing Security Standards. Start Implementing Policies.

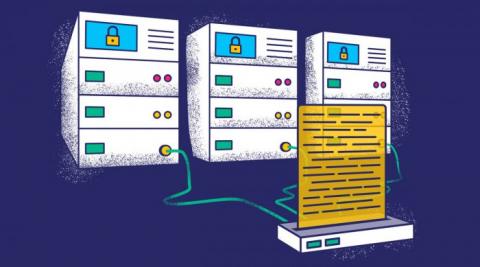
In days gone by, highly regulated industries like pharmaceuticals and finance were the biggest targets for nefarious cyber actors, due to the financial resources at banks and drug companies’ disposal – their respective security standards were indicative of this. Verizon reports in 2020 that, whilst banks and pharma companies account for 25% of major data breaches, big tech, and supply chain are increasingly at risk.

Is CloudWatch Really Cost Efficient?

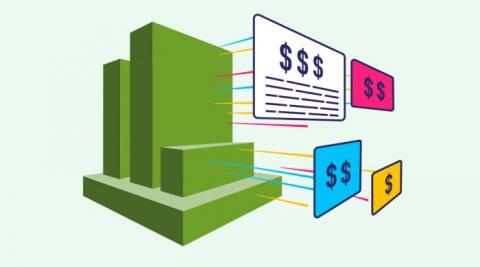
One of the keys to CloudWatch’s success is its no bang, no buck billing system. The pricing structure has been designed from the outset to ensure that CloudWatch users only pay for what they actually use. In addition, the CloudWatch Free Tier allows first time users to test the waters without shelling out. The downside of this flexibility and adaptability is complexity.

Scale Your Prometheus Metrics Indefinitely with Thanos

Prometheus metrics are an essential part of your observability stack. Observability comes hand in hand with monitoring, and is covered extensively here in this Essential Observability Techniques article. A well-monitored application with flexible logging frameworks can pay enormous dividends over a long period of sustained growth, but Prometheus has a problem when it comes to scale.

Looking Back on 2020: A Timeline of Product Innovation

2020 might be a year many of us want to forget, but this year, we also unveiled a variety of new products and features worth remembering. For the Logz.io team, 2020 was a year full of innovation as we worked to continuously improve our product and complete our unified observability vision. We also launched a variety of new capabilities for Logz.io Log Management, Infrastructure Monitoring, Cloud SIEM, and Distributed Tracing, that make our product faster, smarter, and more cost-efficient.

Loki 2020 year in review

What a year 2020 has been for Grafana Loki! Just a little more than a year ago, we announced Loki’s 1.0.0 GA release. We’re excited to report that 2020 brought a big uptick in its adoption (users have quickly realized the advantages of a small index—plus, Loki has non-technical advantages, too); significant performance enhancements; and the recent release of Loki 2.0.

Splunk Connect for Syslog: Turnkey and Scalable Syslog GDI - Part 3

In Part 1 and Part 2 of this series, we explored the design philosophy behind Splunk Connect for Syslog (SC4S), the goals of the design, and the new HEC-based transport architecture, as well as the rudiments of high-level configuration. We'll now turn our attention to the specifics of SC4S configuration, including a review of the local (mounted) file system layout and the areas in which you'll be working.

Splunk Connect for Syslog: Turnkey and Scalable Syslog GDI - Part 4

Previous installments of this series have given you the overview and configuration details you need to ingest any source that is supported by Splunk Connect for Syslog and configure customizations and overrides that match your enterprise. This leaves one key capability of SC4S that we have not yet covered, and that is extending the platform itself. In this installment, we'll walk through the configuration of an entirely new data source – one that SC4S does address out of the box.