Operations | Monitoring | ITSM | DevOps | Cloud

The latest News and Information on Monitoring for Websites, Applications, APIs, Infrastructure, and other technologies.

How to determine the source of SaaS latency

One of the positive things that came out of events in 2020 was that many of us started working from home. At first, it was kind of weird. But once we realized that what we needed was available online, it became easier. All we had to do was figure out a few new apps, like Slack, Asana and Google Docs. Then, after a couple of weeks of working from home, many of us started having thoughts like, “I wonder if I could wear shorts and my favorite slippers?


Proximity Bias is a Serious Concern for Young Workers - How Can You Avoid It?

We’ve all experienced a bit of FOMO at one time or another, whether we stayed home sick the night of a party or failed to score tickets to a big concert. It stings to miss out on the fun, but we get over it. In the era of remote work, however, ‘fear of missing out’ has taken on a more consequential meaning – one that is troubling the minds of many young professionals.

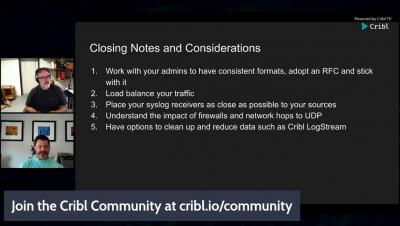
How to Optimize Your Cyber Security and Performance Monitoring Tools Using Load Balancing

The capacity to scale and process high data traffic by monitoring appliances is a critical requirement for organizations aiming to enhance or improve their security and protection from external threats. Excessive incoming traffic demands high-monitoring capabilities as it overwhelms the monitoring tools and places computational bounds that increase exponentially.

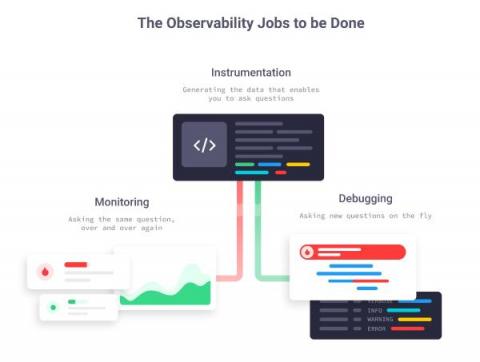
Observability in Practice

After years of helping developers monitor and debug their production systems, we couldn’t help but notice a pattern across many of them: they roughly know that metrics and traces should help them get the answers they need, but they are unfamiliar with how metrics and traces work, and how they fit into the bigger observability world. This post is an introduction to how we see observability in practice, and a loose roadmap for exploring observability concepts in the posts to come.

Seven Critical Capabilities to Look for in an AIOps Tool

In 2017, McAfee found that an average enterprise uses 464 custom applications. A large enterprise — a company with over 50,000 employees — uses 788 custom apps! The more applications you have, the more complex your application environment is. This means that you are more susceptible to outages. So, the tolerance for downtime is impossibly low. Mission-critical applications must be available at all times.

The Persistent Threat of Downtime in Banking and How to Solve it

At 8:54 pm on November 1, 2020, a customer of HDFC bank complained on Twitter that the bank’s services like internet banking and ATMs were down. More customers started raising similar issues over the next couple of hours, saying that UPI, credit card, and debit card transactions weren’t working either. Finally, at 11:55 pm, the bank confirmed that one of their data centers faced an outage. “Restoration shouldn’t take long,” they promised.

Strengthen Your Cloud Ops with Preventive Healing

The cloud is driving enterprise digital transformation. Gartner predicts that by 2026, public cloud spending will exceed 45% of all enterprise IT spending, a 2.5x growth from 2021. Enterprises globally are accelerating application modernization, embracing the cloud. This is giving rise to a few key trends. Software-as-a-Service (SaaS) adoption is on the rise. So, organizations are using applications whose implementation/infrastructure they have little or no control over.

Monitoring network security with Aruba Clearpass, Grafana and Graphite

In this article, we will explore why it is imperative to constantly monitor network security metrics, what Aruba Clearpass is, and how it helps us manage network security. Then we will look at what Graphite and Grafana are and how to analyze metrics with their help. Finally, we will learn how MetricFire can make it easier for us to work with Graphite and Grafana.