What's Next for Streama - Coralogix
Streama© technology allows us to analyze your logs, metrics, and security traffic in real-time and provide long-term trend analysis without storing any of the data.


The latest News and Information on Monitoring for Websites, Applications, APIs, Infrastructure, and other technologies.
All code and no logging makes your application a black box system. Similarly, all logging and no monitoring makes analyzing performance complicated and inconvenient. The goal is to achieve better visibility into the operations of your application, its status, performance, and overall health. Making this information easily accessible presents more context about the critical incidents and surfaces actionable insights for optimizing performance.
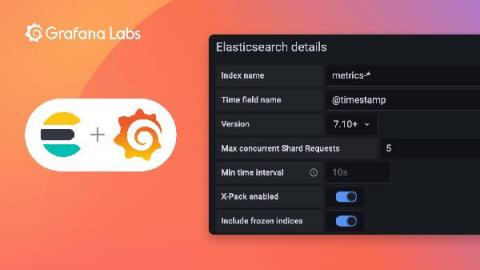
Back in March, we announced that Grafana Labs was partnering with Elastic to build an official Elasticsearch plugin for Grafana. As our CEO Raj Dutt wrote at the time, our “big tent” philosophy “means that we want to support data sources that our users are passionate about. Elasticsearch is one of the most popular data platforms that can be visualized in Grafana.”
As software got more complex, more and more software projects rely on API integrations to run. Some of the most common API use cases involve pulling in external data that’s crucial to the function of your application. This includes weather data, financial data, or even syncing with another service your customer wants to share data with. However, the risk with API development lies in the interaction with code you didn’t write—and usually cannot see—that needs debugging.
Here at RapidSpike, we have an ever-growing list of integrations available to help manage incidents raised from all facets of our system. The latest addition to the roster being Splunk On-Call (formerly known as VictorOps).