Operations | Monitoring | ITSM | DevOps | Cloud

The state of observability in 2025: a deep dive on our third annual Observability Survey

Across companies of all shapes and sizes, observability practices are maturing and getting attention at the highest levels. At the same time, cost and complexity continue to hinder efforts as teams look to emerging tools to help simplify their processes in hopes of better outcomes. With so much in flux, we went into our third annual Observability Survey hoping to get a window into the ways the community is approaching observability and where it wants it to go next.

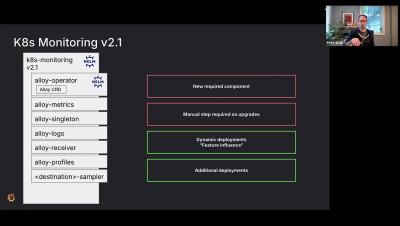
The Biggest Trends Shaping Observability in 2025: Highlights from Grafana Labs' Observability Survey

The Grafana Labs 3rd annual Observability Survey has landed and we're excited to launch a limited video series that breaks down the findings from over 1200 observability practitioners and leaders around the world. In this video, CTO Tom Wilkie breaks down the 4 biggest trends shaping observability in 2025 across open source, executive buy-in, AI, and cost vs. value. Stay tuned for more video explainers!

Top 5 dashboards for DevOps leaders

If you are a DevOps manager you will be keenly aware that the role involves managing multiple toolchains across different clouds, platforms and environments. You also need to report on KPIs, DORA metrics, governance, security and a lot more. At SquaredUp, we understand these demands and have developed a suite of plugins and ready-to-run dashboards to help you reduce toil as well as pull all of your key analytics together within a single pane of glass.

How to redact secrets from logs with Grafana Alloy and Loki

In any observability stack, logs are essential for uncovering insights, troubleshooting issues, and ensuring system health. However, managing the security of logged data presents its own challenges, especially when it comes to preventing sensitive information, like API keys and credentials, from slipping into logs. Secrets can originate from a variety of sources, and it’s often challenging to predict which applications or services might inadvertently expose sensitive information.

An open source app for easily building performance tests: Grafana k6 Studio is generally available

Here at Grafana Labs, we have an on-going commitment to providing solutions that increase productivity without sacrificing ease-of-use. Last year, in line with that effort, we introduced experimental and public preview releases of Grafana k6 Studio, an open source desktop application that helps you create k6 test scripts quickly and easily via a visual interface. Today, we’re excited to share the general availability of k6 Studio v1.0.

Getting started with Azure dashboards

Azure is the cloud service provider of choice for a variety of reasons – such as its ease of use, its wide variety of services, the strong community around it and its integration with other Microsoft services. While Azure comes with native data visualization solutions such as dashboards and workbooks, they require a significant amount of Azure knowledge to create and maintain.

Dashboarding your K6 load tests in SquaredUp

Load testing is an extremely valuable practice for assessing how your application will actually perform in production. Whether you're expecting a handful of concurrent users or anticipate thousands, it's important to have an idea of the kind of loads that will be placed on your systems and be aware of where bottlenecks or saturation may occur.