This is the "Cribl: The Good Bits" version of a webinar we gave recently, which combined the fermented educational joy of a beer tasting led by Gabe Callahan; and the only-slightly-less-intoxicating demos of the Cribl platform, led by Principal Technical Marketing Engineer Leon Adato.
ClickHouse swallows high-cardinality telemetry at ingest, then breaks at query time weeks later. Here is what fails, and how we keep it fast in production. Prathamesh works as an evangelist at Last9, runs SRE stories - where SRE and DevOps folks share their stories, and maintains o11y.wiki - a glossary of all terms related to observability.
DX NetOps now features customizable dashboards that give all users some important new features and capabilities. In addition, with the solution’s new integration capabilities, DX NetOps enables users of current analytics and reporting tools to add standardized dashboards over time.
As a network engineer, you likely face two persistent operational challenges every day: When you have to manually track device lifecycles on spreadsheets or spend your scheduled maintenance periods troubleshooting software upgrades, you lose the time you need to proactively ensure network performance. Over the past six months, we have continued to enhance Network Observability by Broadcom. These latest enhancements directly address the operational challenges outlined above.
Here's a scenario that's playing out in engineering teams across the industry right now. A developer uses AI to rapidly prototype a microservice. The code works. They deploy it to production. Six months later, something breaks. The system is under load, a database connection pools, and the service starts failing in subtle ways. The engineer pulls up the code, but here's the problem, they didn't write it. An AI assistant did. They don't understand the flow deeply. They don't know where to look first.
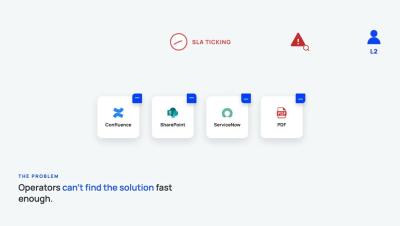
Incident response is a context problem. The first minutes of any incident are spent reconstructing what the affected service is, what it depends on, and who owns it. That reconstruction happens during the worst possible window. The Cortex catalog already holds this data: services, teams, domains, and the relationships between them, maintained by the engineers who run those systems.
Organizations seeking to reduce SLA volatility often attempt incremental enhancements to existing monitoring stacks. While additional analytics layers may improve telemetry visibility, exposure governance cannot function effectively when data, service context, and execution capabilities remain fragmented. Treating exposure management as an add-on capability limits its ability to protect across interdependent systems in real time.
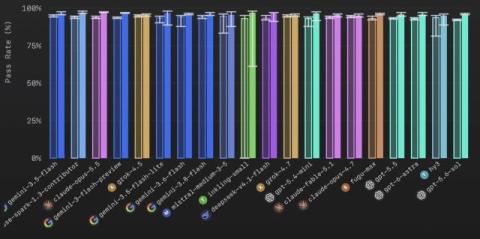
Most teams judge their AI coding agent on two things: the monthly bill and a feeling. The bill tells you what you spent and the feeling tells you whether it seems to be helping, but neither one tells you what the agent actually did. As these tools move into the critical path of how software ships, that gap is starting to matter. I wanted to replace the feeling with something I could measure and understand what shapes of work affects this bill, so I decided to run an experiment on myself.
A test suite can be all green and hit 100% line coverage and still miss bugs. Coverage measures which lines ran during the tests, not whether the assertions actually caught a defect. A test that calls a function but never checks the return value still counts toward the coverage number. The bug it would have prevented still ships.