Operations | Monitoring | ITSM | DevOps | Cloud

Monitoring critical systems at Roblox with Grafana and Grafana Agent

It’s like an obby unto itself: With roughly 100 million global active users, how does an observability team monitor operations and troubleshoot problems that pop up across more than 10,000 servers? In this session, you’ll get an inside look at how the Roblox team evolved their observability platform to combine a multitude of data sources, from low-level hardware health to high-level performance metrics. Grafana Agent plays a key role by replacing many special-purpose pipelines with a single, easy-to-manage tool. Roblox’s observability team has met growing demand to provide actionable insights to hundreds of engineers, covering dozens of data sources and thousands of Grafana dashboards, which all help keep its infrastructure running and ready for play.


Grafana Labs EMEA Virtual Meetup - April 2022

Join Grafanistas Jessica Brown, Marcus Olsson, and Mat Ryer as they present at the April 2022 Grafana Labs Virtual EMEA Meetup. Here's a brief look at their talks: “Extend your Grafana experience through plugins” By default, Grafana comes with an impressive set of different visualizations and data source integrations. But that’s not all! Many more panels and data sources are available as plugins, built by the Grafana community. In this session, you’ll learn about the new in-app plugin catalog and a few nifty plugins to get you started using plugins!

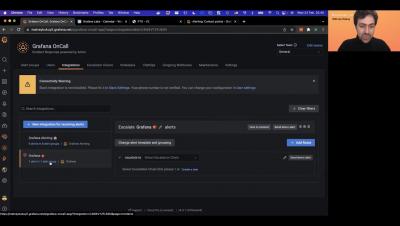
Grafana Incident: First look at the smart incident management tool

Announcing Grafana Incident, the smart incident management tool for your teams. Grafana Incident allows teams to start collaborating immediately by automatically setting up all the essential spaces and resources needed for incident response, from Zoom meetings and Slack channels to a tracker for important tasks and TODO items. A chatbot offers a command-line interface for managing incidents, and provides the ability to instantly embed Grafana queries, dashboards, and metadata, GitHub issues and pull requests, and more. Grafana Incident is available in preview for Grafana Cloud users.