Operations | Monitoring | ITSM | DevOps | Cloud

The latest News and Information on Monitoring for Websites, Applications, APIs, Infrastructure, and other technologies.

From zero to traces: Choosing the right APM instrumentation method for your stack

Instrumenting a tech stack for distributed tracing is a complicated process that often takes weeks. For large fleets running services written in multiple languages, the timeline could be months. Every service needs a tracing library added, configured, and redeployed, and that work has to fit into each team’s release schedule. Datadog’s Single Step Instrumentation (SSI) cuts the time it takes to instrument your applications to send traces to Datadog APM down to minutes.
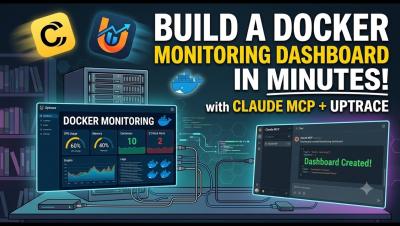
Build a Docker Monitoring Dashboard in Minutes with Claude MCP + Uptrace

In this video, we use Claude MCP to create and merge Docker container dashboards in Uptrace — directly from the terminal, no manual clicking required. What you'll see: CPU, memory, network, and disk I/O dashboards created with plain text prompts Two dashboards merged into one unified view Dashboard exported as YAML for version control.

Why Internal Agents Must Be Rebuilt with Runtime Context

As we entered 2026, enterprises raced to build internal AI engineering agents, automating incident response, code review, and support. The investment was real, but 88% of these pilots never reached production, and teams are now in rebuild mode, trying to understand why. Live runtime validation was the key architectural decision skipped in these v1 agents and it’s still missing from many v2 designs. Agents need to verify their reasoning against production before they act.

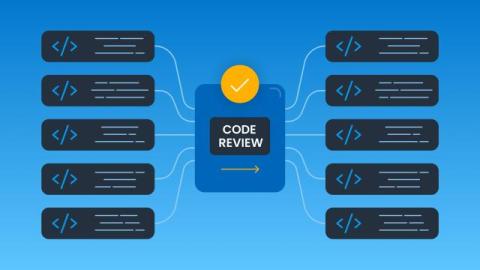
Embracing the Code Review Bottleneck

Roughly a year ago, I left Honeycomb’s SRE team to join the newly formed Tenant team, which works on our Private Cloud offering. This team held some significant challenges on its roadmap if it wanted to demonstrate that the offering was possible, would be worth the cost, and could be done without representing a heavy tax on the rest of the organization.

Monitoring Your Django App Health on Fly.io

Fly.io is a neat choice for deploying Django fast and globally. What it doesn’t really give you out of the box, though, is a deeper picture of an application’s performance. Deployment is only part of the story. No matter which platform you’re using, operating a production application means you need to understand how it behaves. AppSignal helps you fully grasp what happens on the Fly.io server.

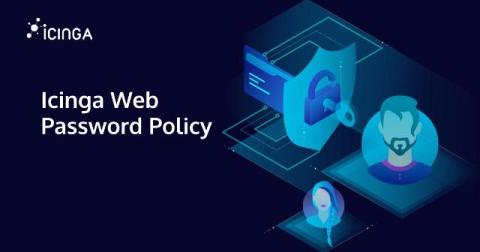
Password Policies in Icinga Web

Icinga Web 2 now ships a PasswordPolicyHook that gives administrators and module developers full control over what constitutes a valid password. Instead of hard-coding a single rule set for every deployment, the hook makes password validation an extension point: any module can register a policy, admins select the active one from the configuration UI, and Icinga Web 2 enforces it everywhere a local password is set or changed.

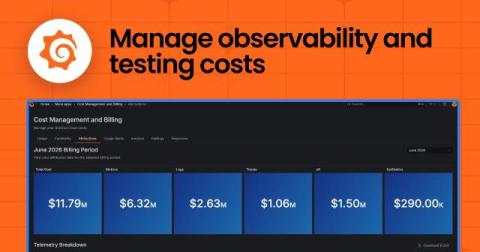
Cost attribution in Grafana Cloud: Manage spend across observability and testing workflows

Knowing what you're spending on observability is useful. Knowing which team, service, or project is driving that spend is what actually lets you act on that information. Cost attribution is a core part of how Grafana Cloud approaches cost management and optimization.