Operations | Monitoring | ITSM | DevOps | Cloud

The latest News and Information on Monitoring for Websites, Applications, APIs, Infrastructure, and other technologies.

Managing Telemetry Data Overflow in Kubernetes with Resource Quotas and Limits

One of the inherent challenges you'll face when working with Kubernetes is that a typical cluster includes many resources that produce telemetry data. Because producing and moving telemetry data consumes resources, you can end up in situations where different workloads are competing for the resources necessary to manage telemetry data.
Understand & Optimize Your Telemetry Data (Subtitled)

The explosion of telemetry data also massively increases your data bill. Teams also cannot control the data they do not understand and often lack the capabilities to act on it once it is understood. Mezmo makes it easier to understand and optimize your data. It helps reduce unnecessary noise and cost, and improve the quality of your data, so that your developers and engineers can consistently deliver on their service level objectives.

5 Cloud Outages Tracker Tools To Monitor Vendors in 2024

Whether you’re a business owner, a tech enthusiast, or simply a user who relies on cloud services for daily tasks, the cloud outage tracker can be a useful tool. It informs you of downtime, degraded performance, and maintenance of services that modern businesses rely on. Here’s the list of cloud outage tracker tools that can help you prepare for and mitigate the effects of inevitable disruptions in the cloud.

Partitioning Data for Query Performance in InfluxDB 3.0

Query performance is critical in any database. Data partitioning is a mechanism that helps prune unnecessary data, allowing queries to run faster. However, there are always trade-offs between large and small numbers of partitions. For instance, fine-grained partitioning on high cardinality columns can reduce performance. This post describes different partitioning schemes supported by InfluxDB 3.0 and explains their trade-offs.

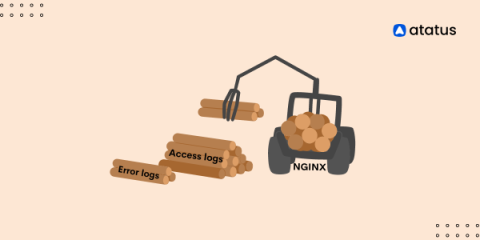
NGINX Access and Error Logs

Nginx, a widely used web server and reverse proxy, maintains two crucial logs that provide valuable insights into its performance and user interactions: the access log and the error log. These logs play a pivotal role in monitoring and troubleshooting web server activities. The access log records every request made to the server, capturing details such as the requested URL, client's IP address, response status code, and user agent.

Alerts Are Fundamentally Messy

Good alerting hygiene consists of a few components: chasing down alert conditions, reflecting on incidents, and thinking of what makes a signal good or bad. The hope is that we can get our alerts to the stage where they will page us when they should, and they won’t when they shouldn’t. However, the reality of alerting in a socio-technical system must cater not only to the mess around the signal, but also to the longer term interpretation of alerts by people and automation acting on them.

A Guide to Visual Regression Testing With Playwright and How to Get Started

I’m pretty sure that you’ve had a situation where you deployed a major UX change on your web app and missed the most obvious issues, like a misaligned button or distorted images. Unintended changes on your site can cause not only a sharp decline in user satisfaction but also a large fall in sales and customer retention. By identifying and resolving these discrepancies before the update went live, you could have prevented these outcomes.

How to Create Great Alerts

We’ve all been guilty of it. Creating rules and filters to hide those alerts that, for the most part, are just noise. Only then to have notifications about a legitimate issue also get swept up by those same filters. There’s only so many times we can break concentration and disrupt productivity before getting fed up with false positives and ignoring everything completely.