Top 5 Reasons Why Splunk Is the Ideal Platform for Unified Security and Observability
Splunk embodies the top 5 principles of unified security and observability, and has been an expert in log management, security, and observability for years.


Splunk embodies the top 5 principles of unified security and observability, and has been an expert in log management, security, and observability for years.
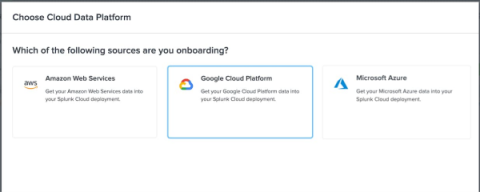
I'm excited to announce that Splunk Data Manager now supports onboarding of Google Cloud Platform (GCP) data sources, effective immediately. With this launch, you can now get the benefits of Splunk data analysis for the high-value events generated by Google Cloud when you onboard GCP data sources into Splunk using Data Manager.
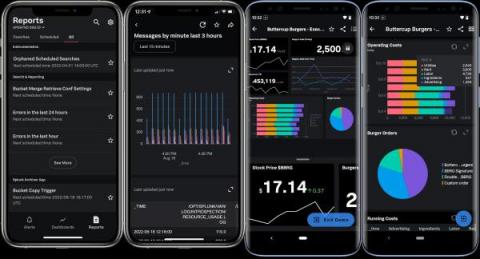
Hot summer days mean beautiful weather for picnics, pool days, and trips with the family. While you’re out this summer enjoying the sun, leave your laptop and backpack behind, because with Splunk Mobile, you’ll always be ready to access dashboards or receive alerts no matter where you are. The new features announced this year at.conf22 let you do even more from the comfort of your pool chaise!
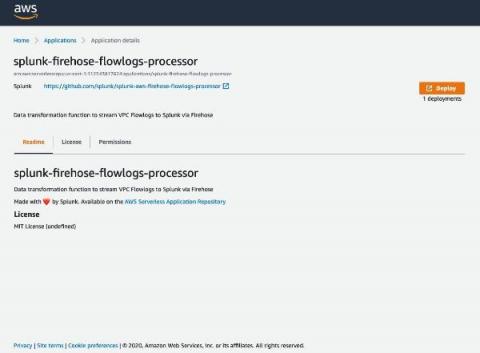
Amazon Web Services (AWS) recently announced the ability to publish VPC Flow Logs directly to Amazon Kinesis Data Firehose. For Splunk customers, this feature helps to optimize the architecture to send VPC Flow Logs directly to Splunk Enterprise or Splunk Cloud Platform. With a fully managed service like Amazon Kinesis Data Firehose, users don’t have to worry about scaling, and can optionally transform their data in near real-time and enjoy the cost-effective, reliable service.
How are you tracking the long-term operation and health indicators for your micro and macro services? Service Level Indicators (SLIs) and Service Level Objectives (SLOs) are prized (but sometimes “aspirational”) metrics for DevOps teams and ITOps analysts. Today we’ll see how we can leverage SignalFlow to put some SLOs Error Budget tracking together (or easily spin up same with Terraform)!
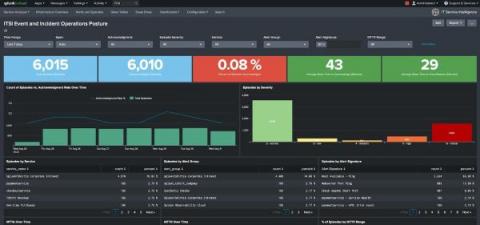
The 1.7 release of the Splunk App for Content Packs comes with a slew of new awesomeness for the Content Pack for ITSI Monitoring and Alerting designed to bolster your IT operations team’s visibility and AIOps posture! Previous versions of the content pack focused on making it easy for you to create and group Notable Events from ITSI Services and third-party monitoring tools.
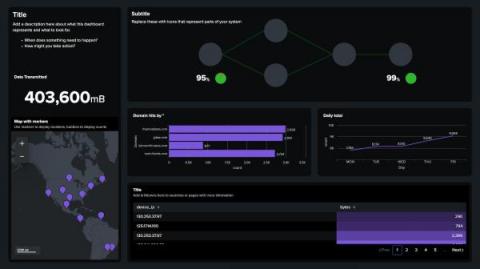
Every day, dashboards are viewed more than 500,000 times at Splunk. They’re what make the sea of data intelligible and help tell a story when working with a team. However, constant net-new dashboard creation is not necessarily a value-add activity — it’s a workflow to rapidly turn data into doing.