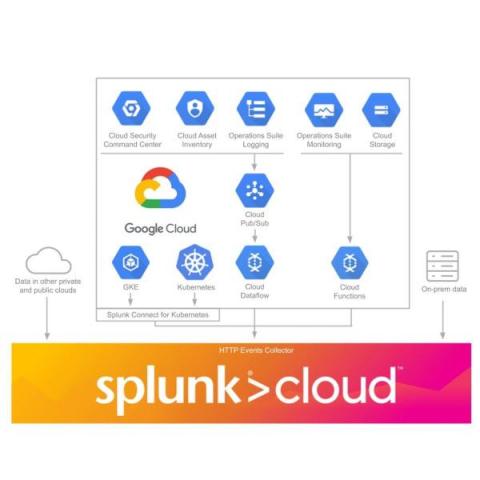
Over the last couple years, cloud transformation has become increasingly critical, evolving from a preferable priority to an urgent imperative. In our rapidly changing world, organizations have had to innovate at unprecedented rates — and those most successful are harnessing the power of cloud to move faster and smarter. But it’s more than a simple migration.
Splunk customers are security conscious organizations demanding enterprise-grade features for their global workforce. Today, we are excited to announce several Splunk Synthetic Monitoring updates, including: support for Single Sign-On (SSO) via SAML 2.0, Concealed Global Variables, and an updated synthetic browser version (Chrome 97).
OpenTelemetry enables Observability, and building observable systems requires you to understand the various ways in which they can fail. Jumping from one possible fix to another and one change to another without fully recognizing the impact on the system can be a significant hindrance to a successful customer experience. In this post, I’ll explain how to get started with OpenTelemetry to help you make your systems more observable.
Over 85% of global organizations will be running containerized applications in production by 2025 say Gartner, with 4 in 5 enterprises expected to move their workloads from on-premises infrastructure to the cloud. Migration to the cloud has IT admins and/or SREs managing an increasingly complex, hybrid IT environment, with an uphill battle of trying to monitor and troubleshoot their infrastructure components and services in real time.
Stability and resiliency of cloud services are top of mind for organizations today. Whether rising to the challenge of a surge in pandemic-driven demand, or fire fighting an unexpected outage, you still have to support your own customers.
A common challenge that I see when working with customers involves running complex statistics to produce descriptions of the expected behaviour of a value and then using that information to assess the likelihood of a particular event happening. In short: we want something to tell us, "Is this event normal?". Sounds easy right? Well; Sometimes yes, sometimes no. Let's look at how you might answer this question and then dive into some of the issues it poses as things scale-up.
A couple months ago, a Splunk admin told us about a bad experience with data downtime. Every morning, the first thing she would do is check that her company’s data pipelines didn’t break overnight. She would log into her Splunk dashboard and then run an SPL query to get last night’s ingest volume for their main Splunk index. This was to make sure nothing looked out of the ordinary.