Operations | Monitoring | ITSM | DevOps | Cloud

Is the Cloud an Experience or a Destination?

In a recent episode of the Cloud Happens podcast, Archana Venkatraman, Associate Research Director in Cloud Data Management at IDC Europe talks about how the cloud isn’t a destination. It’s a continuum; a journey. In this blog, we explore that idea a bit more and dive into what really encapsulates a cloud experience. How can modern enterprises benefit from their cloud journey to solve the most gnarly data challenges to unlock innovation, enhance security, and drive resilience.

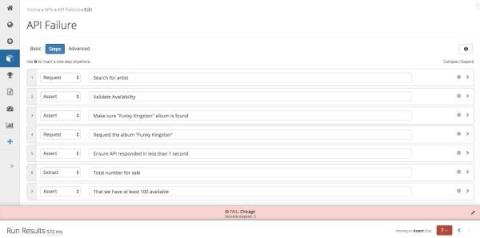
API & HTTP Headers: How to Use Request Headers in API Checks

In previous posts we covered why it’s important to monitor APIs and how to monitor and validate data from APIs. In this post we’ll focus on a simple but key feature that helps Splunk Synthetic Monitoring users create robust checks for availability, response time, and multi-step processes: Request Headers

Quickly identify client side errors and latency, with Splunk RUM

Splunk RUM (Real User Monitoring) helps software engineers quickly identify and isolate the most glaring client side performance issues, from errors to latency. Easily measure performance across your entire production environment, to specific services or applications, and seamlessly click into backend service performance.

SRE Metrics: Four Golden Signals of Monitoring

SRE (site reliability engineering) is a discipline used by software engineering and IT teams to proactively build and maintain more reliable services. SRE is a functional way to apply software development solutions to IT operations problems. From IT monitoring to software delivery to incident response – site reliability engineers are focused on building and monitoring anything in production that improves service resiliency without harming development speed.

Splunk Beyond Logs: Getting to Observability

Those of us of a certain age know well the saying “Nobody got fired for buying IBM.” In the log analysis and security world, we’ve become lucky to get to the point where people are saying “Nobody gets fired for buying Splunk.” Our success in these areas has definitely created a perception for what products Splunk has and what we can offer to our customers. The problem is that most of these perceptions don’t capture the full power of Splunk.

Observability for AWS Fargate Deployments Powered by Graviton2 Processors

Today, cloud native technologies empower a number of organizations to build and run scalable applications in public, private and hybrid cloud environments. Developer and operation teams can build and deploy applications, APIs and microservices architectures with the speed and immutability of containers. Gartner predicts that by 2024, more than 75% of large enterprises in mature economies will be using containers in production.

Introducing New Storage Dashboards in the Cloud Monitoring Console (CMC)

Monitoring and gaining additional insights about usage of your Splunk Cloud Platform deployment is essential for effective management as a Splunk admin. Your Splunk Cloud comes with the Cloud Monitoring Console (CMC) app, which displays relevant information about the status of your Splunk Cloud environment using pre-built dashboards.