Grafana Agent v0.35 is here! The latest release of the Grafana Agent brings with it loads of new features and enhancements. Today, we’ll highlight our work on horizontal scalability and making it simpler than ever to get started using the Agent. Let’s take a look!
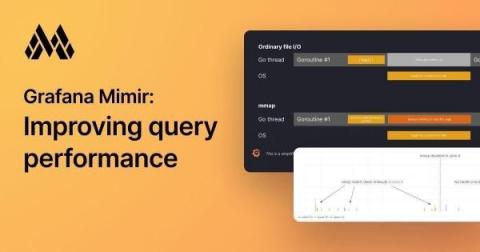
In recent months, we have been working on improving the performance of Grafana Mimir, the open source, horizontally scalable, highly available, multi-tenant TSDB for long-term storage of your metrics.
Since Grafana started 10 years ago, there have been more than 43,000 commits to the open source project. Grafana founder Torkel Ödegaard has made more than 7,600 of those commits, and he recently reflected on some personal favorites he’s worked on, ranging from early query builders to the latest navigation updates. Torkel isn’t the only one who has strong feelings.
Anna Kapuścińska is a Software Engineer at Isovalent, who has a rich experience wearing both developer and SRE hats across the industry. Now she works on Isovalent observability products such as Hubble, Tetragon, and Timescape, as well as the respective Grafana integrations for all of them.
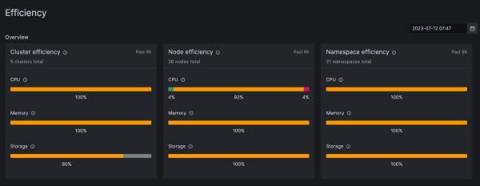
Greetings, Kubernetes Time Lords! Through a series of recent updates to our multi-purpose Kubernetes Monitoring solution in Grafana Cloud, we’ve made it easier than ever to assess your resource utilization, whether you’re looking at yesterday, today, or tomorrow. All companies that use Kubernetes, regardless of size, should monitor their available resource utilization. If a fleet is under-provisioned, the performance and availability of applications and services are at serious risk.
Grafana is a rich platform for data visualization, giving you full control over how your data should be visualized. However, this flexibility and freedom comes with some challenges from a security perspective — challenges that need to be solved to protect the data in Grafana. For years, cross-site scripting (XSS) has been among the most common web application security vulnerabilities.
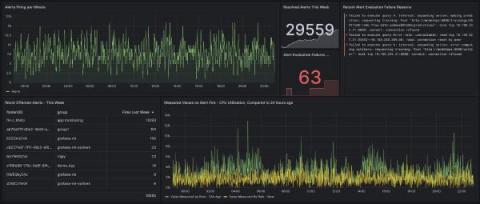
The Prometheus alerting model is a flexible tool in every observability toolkit. When enhanced with Grafana data sources, you can easily alert on any data, anywhere it might live, using the battle-tested label semantics and alerting state machine that Prometheus defines. Often, engineers want to see patterns in their alerts over time, in order to observe trends, make predictions, and even debug alerts that might be firing too often.