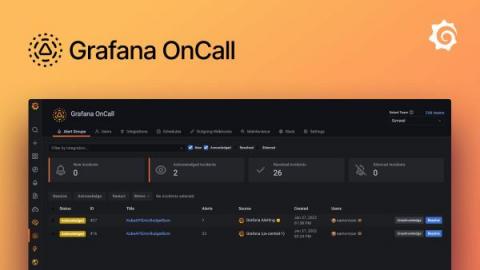
Today we’re announcing the general availability of Grafana OnCall on Grafana Cloud for all paid and free plans. A big part of delivering great software is ensuring the right people get the right information when the inevitable incidents occur. We want to help you do that with Grafana OnCall, an easy-to-use, developer-first on-call management tool that’s built on top of the Grafana stack you know and love.
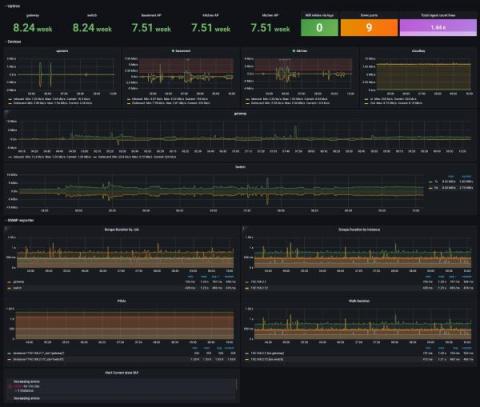
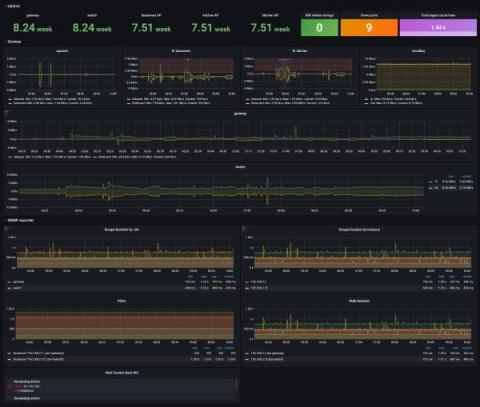
In your career, if your role has ever included the monitoring or managing of any network infrastructure devices such as switches, routers, firewalls, etc., you’ve very likely heard of SNMP. In case you haven’t, SNMP stands for Simple Network Management Protocol, and, unlike its name suggests, it is anything but simple. It is a standard protocol for collecting information from network devices and organizing it in a way that humans can (sort of) understand.
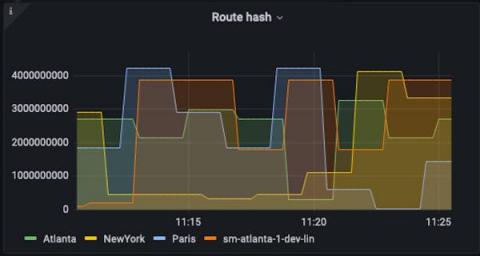
One of the powerful tools available in Grafana Cloud is Synthetic Monitoring, a black box monitoring solution that can provide insights that are hard to get in other ways. It provides a different view of your application by observing performance and uptime externally and from all over the world. As a result, you can build an understanding of what your end users are actually experiencing. However, as great as it is, synthetic monitoring does have limitations.
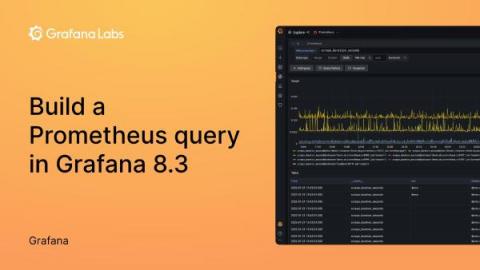
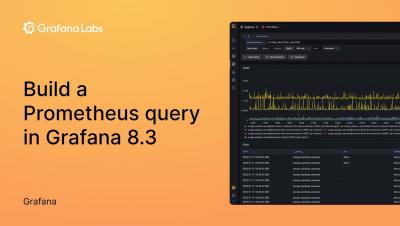
Once you have set up your Prometheus data sources in Grafana, it’s time to put them to work. In the one-minute tutorial video below, we show you how to build a query in Grafana 8.3 with Grafana’s easy-to-use Explore mode. Prometheus uses a query language called PromQL. If you are already familiar with PromQL, you can simply enter your query in the text field and run the query.
Grafana Tempo 1.3 has been released! We are proud to add the capability to search the backend datastore. This feature will also appear soon in Grafana Cloud Traces. If you want to dig through the nitty-gritty details, you can always check out the v1.3 changelog. If that’s too much, this post will cover the big ticket items. You can also register for our upcoming webinar “Distributed tracing in Grafana: From Tempo OSS to Enterprise” on Jan.
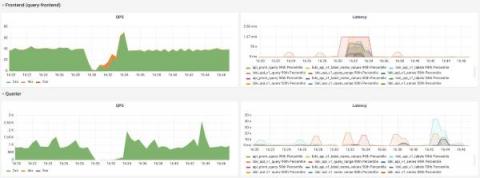
Beep, beep, beeeeeeeep. Read path SLO page, again. And I’ve almost found the noisy neighbor! That was me. And will probably be me again at some point in the future. As we continue to scale up the team that builds and runs Grafana Loki at Grafana Labs, I’ve decided to record how I find and diagnose problems in Loki.
Networks are the backbone of inter-communications within computer systems and applications. When networks go down or experience any interruption of service, the impact is widely felt and can result in significant service disruptions and lost revenue. This is why network monitoring is mission critical for organizations. Visibility into network performance is key to ensuring that network engineering teams can be more proactive and identify problems before those issues cause outages.