Operations | Monitoring | ITSM | DevOps | Cloud

Centralized Alert History in Grafana; GA in 11.2 | Grafana

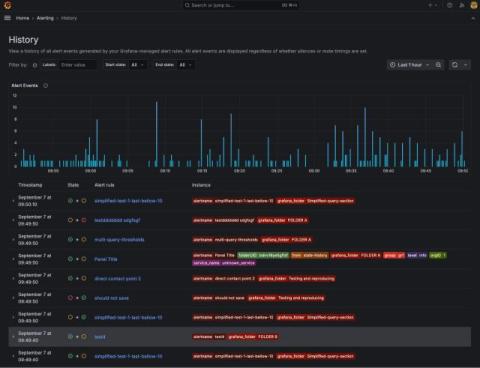
With the centralized alert history page, you can view a history of all alert events generated by your Grafana-managed alert rules from one centralized page. This helps you see patterns in your alerts over time, observe trends, make predictions, and even debug alerts that might be firing too often. Grafana Cloud is the easiest way to get started with Grafana dashboards, metrics, logs, and traces.

Gain actionable insights with real user monitoring: the latest features in Grafana Cloud Frontend Observability

One of the biggest challenges observability teams face today is gaining end-to-end visibility into their cloud native apps, including modern browser frontends. Without that visibility, you potentially open the door to bad end-user experiences that can hurt customer satisfaction, reduce search engine discoverability, and interfere with overall business goals. This is the exact challenge we address with Grafana Cloud Frontend Observability.

Multi-cloud monitoring made easy: monitor AWS, Microsoft Azure, and Google Cloud services all in one app

Managing multi-cloud environments often means juggling different monitoring tools for each provider, leading to increased complexity and operational overhead. To solve for that, we’re excited to introduce Cloud Provider Observability — an application for monitoring AWS, Microsoft Azure, and Google Cloud services, all in Grafana Cloud.

How to aggregate metrics but retain critical data: Introducing Exemptions in Adaptive Metrics

When you hear about Adaptive Metrics in Grafana Cloud, all signs point to how it’s a game changer. Adaptive Metrics, which aggregates unused and partially used metrics into lower cardinality versions, has delivered a 35% reduction in metrics costs on average for more than 1,200 organizations. Companies have also spoken candidly about the cost savings they gained from the feature.

Introducing Cloud Provider Observability in Grafana Cloud | Demo | Grafana Labs

Learn how multi-cloud monitoring just got easier with Cloud Provider Observability in Grafana Cloud. In this video, you'll get glimpse at how the new app can enhance your observability strategy for all your major cloud providers. Plus you'll get a quick walk-through of the app.

How to Reduce Metrics Costs with Grafana Cloud Adaptive Metrics | Grafana Labs

Grafana Cloud Adaptive Metrics has helped users save up to 70% on observability costs by automatically aggregating unused and partially used metrics. This video features a demo on Adaptive Metrics, where you’ll learn what we mean by “adaptive” — automating the process of recommending which metrics to drop while giving you the flexibility to determine any exemptions. This boils down to maintaining effective observability while reducing costs.

Grafana Cloud updates: new data visualization options, enhancements to Grafana Cloud k6, and more

We consistently roll out helpful updates and fun features in Grafana Cloud, our fully managed observability platform powered by the open source Grafana LGTM Stack (Loki for logs, Grafana for visualization, Tempo for traces, and Mimir for metrics). In case you missed it, here’s a roundup of the latest and greatest updates for Grafana Cloud this month. You can also read about all the features we add to Grafana Cloud in our What’s New in Grafana Cloud documentation.

New Grafana k6 features: TypeScript support, async APIs for browser, and more

About every two months, the Grafana k6 team releases a new version of the open source load testing tool to deliver new features and further enhance the user experience. In case you missed them, here’s a recap of recent k6 releases and some of the exciting updates they brought to our user base. Many of the features highlighted in this post relate to new web APIs that the community has been asking for, and that are widely used by JavaScript developers.