Real-time stock data with Apache Flink and Apache Kafka
Aiven for Apache Flink® With Apache Kafka® and Apache Flink®, you can now have coding-free support for real-time data processing and streaming analytics! Find out how ->


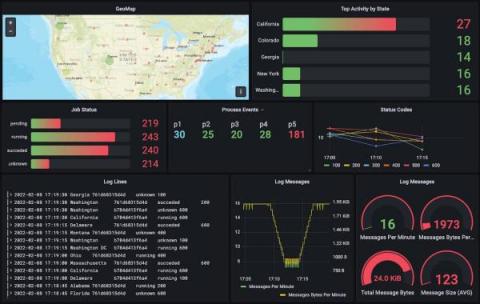
Back in November 2021, Grafana Labs released version 2.4 of Grafana Loki. One of the new features it included was a Promtail Kafka Consumer that can easily ingest messages out of Kafka and into Loki for storing, querying, and visualization. Kafka has always been an important technology for distributed streaming data architectures, so I wanted to share a working example of how to use it to help you get started.
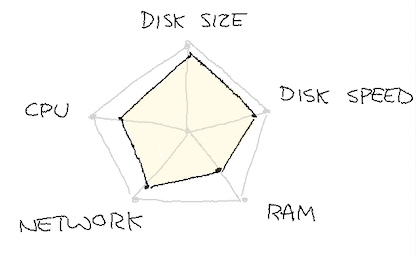
When you send telemetry into Honeycomb, our infrastructure needs to buffer your data before processing it in our “retriever” columnar storage database. For the entirety of Honeycomb’s existence, we have used Apache Kafka to perform this buffering function in our observability pipeline.
In a perfect world, small pieces of software scale up and down with a high-performance message broker like a heart, pumping data in a controlled, efficient manner. However, at some point, in every single system, an application starts pumping out large data requests, in a sporadic, uncontrollable manner. Because here, we are talking about the real world, right? In this article, we will address the problem of adapting a legacy system to play with a stream-based platform.