Operations | Monitoring | ITSM | DevOps | Cloud

Latest Posts

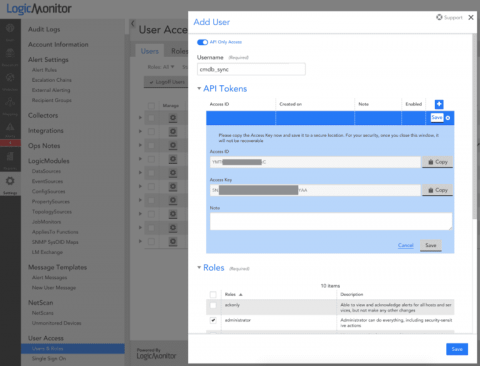
Getting Started with the LogicMonitor - ServiceNow CMDB Integration

A Configuration Management Database (CMDB) contains all relevant information about the hardware and software components used across an organization’s IT environment. Even more important, a CMDB defines the relationships and interdependencies between those assets. This makes it easy to understand, manage and report on the service being delivered.

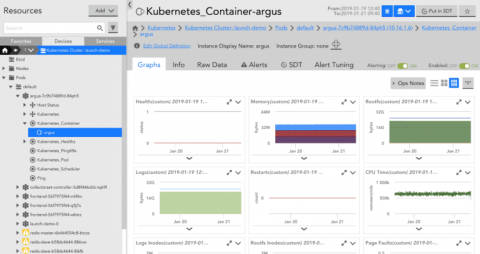
How to Monitor GKE with LogicMonitor

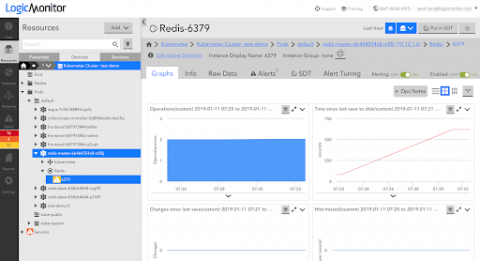
Google Kubernetes Engine (GKE) is a managed Kubernetes service that makes it possible to run Kubernetes clusters without managing the underlying infrastructure. With GKE, DevOps teams can scale and deploy applications faster with Kubernetes, while spending less time on cluster maintenance and configuration. Obtaining enough insight into GKE is key to proactively preventing downtime and maximizing application performance.

Browser Automation: Using the Gmail API to Retrieve MFA Codes

In a separate article, we introduced the concept of performing synthetic transactions with LogicMonitor to ensure website services are up and running correctly. It may be necessary to authenticate with a website before you can fully monitor it, and authentication may require presenting an MFA code that has been delivered via email. Let’s take this a step further and incorporate an MFA (Multifactor Authentication) Challenge.

How to Monitor Azure VM Scale Sets

With Azure Virtual Machine (VM) Scale Sets you can automatically scale the number of VMs running an application based on the compute resources required. VM Scale Sets make it easier to deploy and manage a large number of Virtual Machines consistently and allow you to use and pay for the minimum resources needed at any given time, but they also introduce a few monitoring challenges.

How To Monitor Almost Anything: Lifehacking Diabetes

What can you monitor with LogicMonitor? There are only two limitations. As a Sales Engineer, I'm often asked questions like "Do you monitor (insert specific technology resource here)?". Equally often, I'm asked whether and how easily LogicMonitor's core abilities can be extended to gather metrics from any resources that may be specific to the customer.

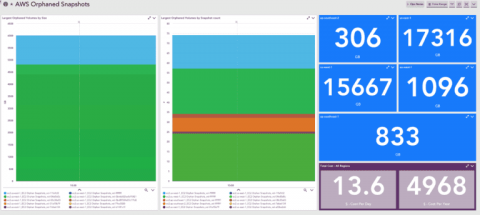
How to Identify Orphaned EBS Snapshots to Optimize AWS Costs

So a while back I got an email from our finance team. I was tasked to assist with tagging resources in our AWS infrastructure and investigate which items are contributing to certain costs. I don’t know about other engineers, but these kinds of tasks are on the same realm of fun as … wiping bird poop off your windshield at a gas station. So I did the sanest thing I could think of.

LM Unleashed: 2019 Global Kick-off

Last week, the LogicMonitor executive staff kicked off a global tour across the LM offices to celebrate 2018 wins and share the company vision moving into 2019. This annual Company Kick-Off event (CKO) remains a strong tradition here at LogicMonitor, allowing team members to celebrate, collaborate and fuel-up for success in the coming year.

Preparing for Browser Automation by Using Web Developer Tools to Identify HTML Elements

In a separate article, we introduced the concept of performing synthetic transactions with LogicMonitor. An obviously crucial step of that process is actually scripting the automation. You can have all the right automation tools installed but how do you get started with the actual script? This article will help illustrate some of the preparation needed for developing a browser automation script.

Key Metrics for Monitoring Google Cloud App Engine

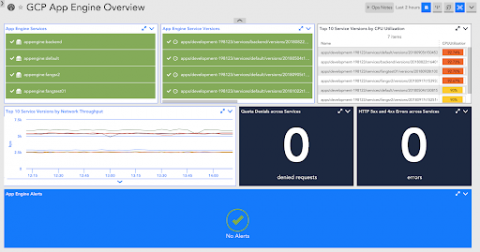
Google Cloud App Engine is a serverless platform that enables users to develop and deploy applications. App Engine allows developers to focus more on building applications and less on managing infrastructure. Even though you don’t have to worry about maintaining any underlying infrastructure, you do have to ensure that you have enough visibility into App Engine health and performance to proactively prevent downtime.