Operations | Monitoring | ITSM | DevOps | Cloud

Latest News

Our Check Overview Page Has a Fresh New Look

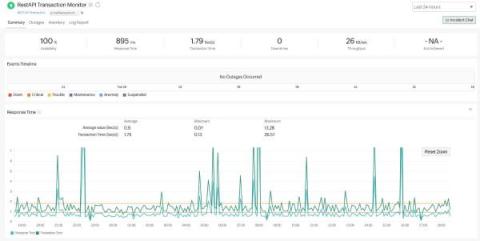
We are very excited to announce that we redesigned our monitoring results chart to make it easier for you to understand check performance over time and easily investigate any past anomaly. The redesign is a result of our UX research that showed that the old check overview chart made it challenging for users to find check results from the past. While we were redesigning our monitoring results charts, we wanted to achieve two things: And, we achieved this in three attempts. Let’s dive in.

An SRE's Most Important Skill? Communication

I wish someone had told me that I shouldn’t hop between frameworks. Just like learning four programming languages in your first year, in my experience spending time content switching as a beginner is wasted effort. If I’d spent a solid year learning how to deploy services on AWS, then when it was time to learn Azure, I’d see more similarities than differences and find it a lot easier to pick up a second public cloud.

How to use Tailscale for gRPC authentication in Golang

Friends of this blog know that I am a big fan of building internal tools, or as we call them, "tools that help scale people". As the name suggests, internal tools are used, well, internally and as such usually will require their access to be restricted to the company's staff and network. In the past, I've written about how to use Tailscale for authentication of internal tools using HTTP. In this post, I will show you how to use Tailscale for gRPC authentication in Golang.

Track Errors in FastAPI for Python with AppSignal

When you first try a new library or framework, you are excited about it. However, as soon as you run something on production, things are less than ideal — an error here, an exception there - bugs everywhere! You start reading your logs, but you often lack context, like how often an error happens, in what line, etc. Fortunately, tools such as AppSignal can help. AppSignal helps you track your errors and gives you a lot of valuable insights.

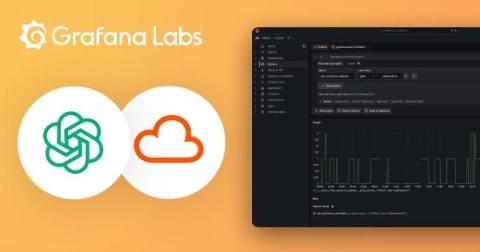
How to automate image analysis with the ChatGPT vision API and Grafana Cloud Metrics

OpenAI’s ChatGPT has an extraordinary ability to process natural language, reason about a user’s prompts, and generate human-like conversation in response. However, as the saying goes, “a picture is worth a thousand words” — and perhaps an even more significant achievement is ChatGPT’s ability to understand and answer questions about images.

Why you should monitor microservice mediator APIs

Microservice mediator APIs provide a flexible, scalable, and decentralized approach to microservices communication, enabling organizations to build robust, modular, and maintainable applications. They shield microservices from the details of the other implementations and promote loose coupling, helping to ensure autonomy, scalability, and independence among microservices.

How to use HTTP APIs to send metrics and logs to Grafana Cloud

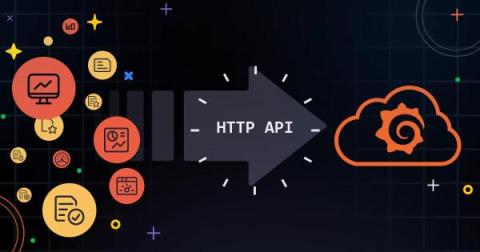
Integrating monitoring and logging into your application stack is crucial for maintaining performance, enhancing security, and streamlining troubleshooting. Grafana Cloud offers a robust solution for monitoring your applications by collecting metrics and logs using an agent, such as Grafana Agent, but there are many environments where this isn’t feasible.