Operations | Monitoring | ITSM | DevOps | Cloud

Latest Videos

How to navigate alerting insights in Grafana Cloud

Navigate your alerting systems in Grafana Cloud with the new Alerting Insights feature. This enhanced landing page provides a comprehensive view of your alerting data, from Grafana managed rules to Mimir managed rules, and highlights critical trends in your organization's alert management performance.

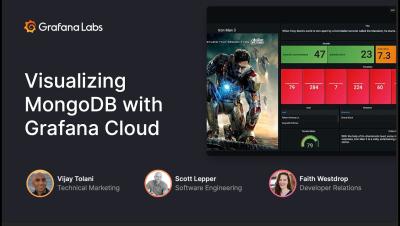
Visualizing MongoDB with Grafana Cloud

Learn to connect your MongoDB data and other data sources to a single dashboard to provide impactful insights into your business and improve visibility across teams. Vijay Tolani will demonstrate how to translate and transform your existing application and business metrics into flexible and versatile charts within dashboards using a wide array of visualizations, such as panels, bar gauges, geomaps, and more. Also query and alert on MongoDB and MongoDB Atlas data in real time without having to migrate or ingest it.

Grafana Labs' new AI-powered chatbot

Got questions about Grafana? Just ask Grot, Grafana's new AI-powered chatbot (still in beta). Built in partnership with Pal, a company that creates AI assistants for businesses, and inspired by our bulbous dino mascot, Grot the chatbot has been trained with large language models (LLM) on Grafana Labs’ own content. It can help you easily answer just about any question about our Grafana LGTM Stack, our open and composable hosted Grafana Cloud platform, and more — regardless of how narrow or broad the query might be or what language is set in your browser.

Agentless monitoring for Prometheus in Grafana Cloud (Grafana Office Hours #15)

Did you know you could do agentless monitoring for Prometheus in Grafana Cloud? Senior Software Engineer Matt Nolf talks about the new Metrics Endpoint integration and how you can use it to collect Prometheus metrics from publicly addressable hosts-- WITHOUT using Grafana Agent. He is joined by Developer Advocates Nicole van der Hoeven and Paul Balogh.

Distributed tracing with Grafana Cloud k6 (Grafana Office Hours #14)

Senior Software Engineer Łukasz Gut talks about a new feature: Distributed Tracing with Grafana Cloud k6. He discusses what distributed tracing is, why it matters, and how it can help teams find reliability issues faster. He is joined by Developer Advocates Marie Cruz and Nicole van der Hoeven.

AWS PrivateLink for Grafana Cloud

Navigating secure connectivity and managing data transfer costs are vital to optimizing your cloud-based services. AWS PrivateLink offers a solution to improve security and reduce costs, especially when integrating with Grafana Cloud. In this tutorial, we delve into the problems solved by PrivateLink, its working mechanism, and a step-by-step guide on configuring it to connect to Grafana services. What You'll Learn.

How to deploy Grafana on Kubernetes (Grafana Office Hours #13)

Senior Developer Advocates Nicole van der Hoeven and Usman Ahmad talk about how to deploy Grafana on Kubernetes for beginners: what Kubernetes is, how it's an evolution of distributed computing, what its relationship to Docker is, other things you might need to know to work with Kubernetes, and how you can deploy Grafana on your own Kubernetes clusters.