Operations | Monitoring | ITSM | DevOps | Cloud

The latest News and Information on Log Management, Log Analytics and related technologies.

Smooth Scaling: Reducing Overhead with Cribl Stream

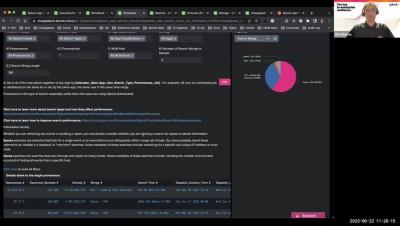
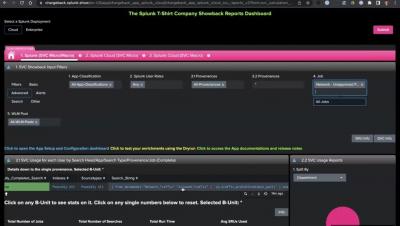
When I was still writing code, our Splunk license only had enough capacity to monitor our Production environment. So we stood up a self-managed Elastic cluster for our lower environments. This quickly became unmanageable as we started logging more and adding additional environments. As I spend more time in the field, I see this pattern repeated over and over.

Introduction to ELK Tech Stack

ELK Stack, also known as the Elastic Stack is a powerful and versatile open-source toolset that has revolutionized the way businesses manage and analyze their data. ELK Stack seamlessly integrates these three robust components to offer a comprehensive solution for searching, analyzing, and visualizing large volumes of data in real-time. So, buckle up, for a comprehensive overview of the ELK stack and its components, which will be a great starting point for beginners.

Mastering SVC with Splunk App for Chargeback: App Walkthrough (Part 1)

Part 1 of a series of 3 videos outlining how you can use Splunk App for Chargeback to successfully adopt Splunk’s Workload Pricing. These videos will help you get quick insights and proactively monitor key metrics using the Chargeback app’s out-of-the-box capabilities, and then tie usage to business hierarchy to enable chargeback. It will ultimately help you get back in control of how your teams use Splunk by showing you how to identify and manage wasteful workloads.

Mastering SVC with Splunk App for Chargeback: Platform Optimization (Part 3)

Part 3 of a series of 3 videos outlining how you can use Splunk App for Chargeback to successfully adopt Splunk’s Workload Pricing. These videos will help you get quick insights and proactively monitor key metrics using the Chargeback app’s out-of-the-box capabilities, and then tie usage to business hierarchy to enable chargeback. It will ultimately help you get back in control of how your teams use Splunk by showing you how to identify and manage wasteful workloads.

Mastering SVC with Splunk App for Chargeback: Mapping Business Hierarchy (Part 2)

Part 2 of a series of 3 videos outlining how you can use Splunk App for Chargeback to successfully adopt Splunk’s Workload Pricing. These videos will help you get quick insights and proactively monitor key metrics using the Chargeback app’s out-of-the-box capabilities, and then tie usage to business hierarchy to enable chargeback. It will ultimately help you get back in control of how your teams use Splunk by showing you how to identify and manage wasteful workloads.

14 Critical Log Files You Need to Monitor for System Security

In the realm of Linux system administration, monitoring log files is essential for maintaining a healthy and secure environment. Linux distributions generate a multitude of log files that capture crucial information about system events, errors, and user activities. These log files act as a silent witness, providing valuable insights into the inner workings of a Linux system.

Transforming Your Telemetry Has Never Been Easier

As the foundation of your observability stack, BindPlane OP provides great visibility into your telemetry data, all the way from collection to its final destination. With the introduction of Live Preview in BPOP Enterprise, and a brand new processor workflow, we’ve now made this even better.

5 Tips for Faster Troubleshooting to Reduce MTTR

In today’s rapidly evolving digital landscape, organizations heavily rely on their applications and systems to deliver optimal performance. As such, driving down the key metric of Mean Time to Resolution (MTTR) is clearly one of the biggest challenges facing observability practitioners today.