Operations | Monitoring | ITSM | DevOps | Cloud
Logging
The latest News and Information on Log Management, Log Analytics and related technologies.
What Should You Do When You Receive Event Log Monitor Alerts?
When you are installing PA Server Monitor, you will need to configure what occurs when there are event log monitor alerts. You typically set this up during the initial install. However, it is not uncommon to want to make changes and updates or even add new events to your server monitoring software as you become more familiar with it.
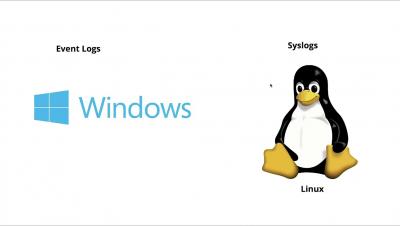
Resource check profile - Monitor Windows event logs and Linux syslogs
Integrating Logging into CI/CD
Getting Started with Elastic Cloud: A FedRAMP Authorized Service
Elastic Cloud is available for US government users and partners who want to harness the power of enterprise search, observability, and security to make mission-critical decisions. Elastic Cloud is FedRAMP authorized at Moderate Impact level so federal organizations and other customers in highly regulated environments can quickly and easily search their applications, data, and infrastructure for information, analyze data to observe insights, and protect their technology investment.
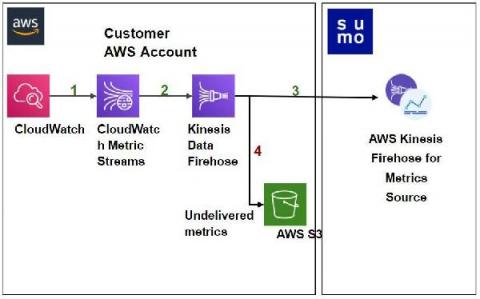
Sumo Logic joins AWS to accelerate Amazon CloudWatch Metrics collection
The Untapped Power of Key Marketing Metrics
Marketing and Site Reliability teams rarely meet in most organizations. It’s especially rare outside the context of product marketing sessions or content creation. With observability now pivotal to success, we should be looking to bring the two together for technical and commercial gains. In this piece, we’re going to explore the meaning of observability and its relevance to marketing metrics.
Unlocking Hidden Business Observability with Holistic Data Collection
Why do organizations invest in observability? Because it adds value. Sometimes we forget this when we’re building our observability solutions. We get so excited about what we’re tracking that we can lose sight of why we’re tracking it. Technical metrics reveal how systems react to change. What they don’t give is a picture of how change impacts the broader business goals. The importance of qualitative data in business observability is often overlooked.
Explore Prometheus Metrics with Logz.io Infrastructure Monitoring
Metrics Explore is the Logz.io feature for deep dives into Prometheus metrics. Similar to Kibana Discover, it allows for easy querying, pull-down list selections, and other ways to navigate your data. Best yet, you can explore important metadata for detailed metric analysis. There are a few ways to move around the metrics in your system. Get started by finding the Explore icon on the left-hand menu.


