Operations | Monitoring | ITSM | DevOps | Cloud
Logging
The latest News and Information on Log Management, Log Analytics and related technologies.
10 Best Splunk Alternatives [2023 Comparison]
In the website monitoring and observability space, there are few names that hold as much weight as Splunk. Established in 2003, Splunk is highly focused on log data visualization and analysis but offers a wide range of tools to help you monitor your applications. All of that being said, just because it’s been around a while doesn’t mean that it’s right for everyone.
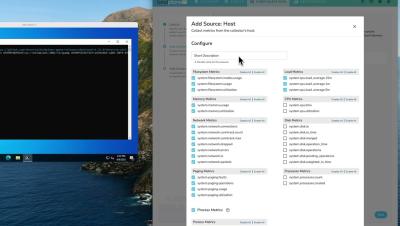
Getting Started with BindPlane OP and Google Cloud Operations
Install the BindPlane Agent on Windows
Linux Log Management: Advanced Techniques and Best Practices
Linux log management is critical to maintaining system health, troubleshooting issues, and ensuring security. This article explores advanced techniques and best practices for effectively managing Linux logs. Whether you're a seasoned Linux administrator or a newcomer, these insights will help you optimize your Linux log management processes.
How to Troubleshoot Slow Web Applications With Sematext
Maintaining a smooth operation of your web application is crucial for the success of your business. When customers encounter performance issues while using your application, it will likely affect your business reliability and customer satisfaction. This can lead to churn rate increase which will cause a loss of revenue. As a Site Reliability Engineer (SRE) or DevOps professional, you would want to keep your product reliable for end users.
How to Extract Numerical Values from API Responses
Extracting numerical values from public or private JSON API responses can help you track and analyze data, easily spot trends, and alert on data that is important to your business. If you can passively have this information periodically come to you and if you can receive alert notifications when certain conditions are met, you can avoid checking each metric manually and – obviously – save a ton of time. Synthetic monitoring tools let you do these things automatically.
How to Periodically Extract Webpage Performance Metrics from Browser API
To ensure a good end user experience, smart businesses periodically gather performance data from their websites. They measure the responsiveness and speed of their services to ensure fast and reliable websites. Having a responsive and fast website improves companies’ conversion rates, keeps their reputation intact, and helps increase traffic and revenue. Website monitoring applications help determine whether the website achieves the desired response times and uptimes.
How to Track Your Company's Rating on a Website
Websites provide advisory services, research, and user reviews on SaaS companies to help users find the right product for their needs. Information and reviews shared by genuine users of your product or service is the strongest recommendation that can be received by your potential customers. This is why online user reviews are important for eCommerce and SaaS companies.
How to Extract Numerical Data from a Web Page for Dashboarding and Alerting
Over the years working as a software engineer and now a product manager, I’ve encountered multiple situations where I needed to extract numerical data from a page on a periodic basis and create visualizations, typically line charts to help me see trends over time. For example, I wanted to extract product prices and monitor them over time. Or, I wanted to query a search engine periodically and extract the number of matches or the position of a specific page for SEO purposes.


