The latest News and Information on Observabilty for complex systems and related technologies.
My team was not happy with me. I had just convened a meeting of my direct reports — and the managers that reported to them — to deliver the news personally. “No more new tools,” I told them. “We have everything we need to do our job. Our environment just doesn’t change that fast. So stop bringing me requests for new tools. The answer is no.” It was unquestionably the right call at the time, but today, it would be laughable.
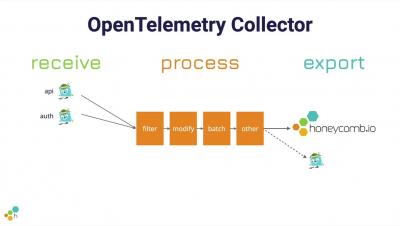
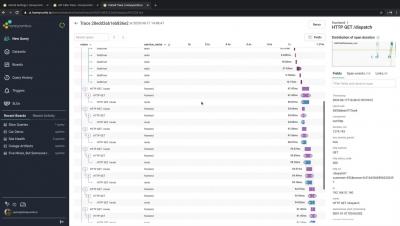
We’ve released support for tracing header interoperability in all of our Beelines. This means you can now mix and match distributed services instrumented with Beelines or with OpenTelemetry, and your traces will be preserved in Honeycomb!
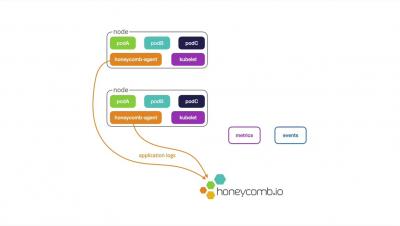
Kubernetes is a popular container orchestration system at the heart of the Cloud Native Computing Foundation projects. It automates the deployment, lifecycle, and operations of containers, containerized applications, and "pods," which are groups of one or more containers. The platform itself, along with each of these workloads, may generate event data. There are different kinds of data associated with these processes.
You may have seen the Honeycomb white paper on metrics, and want to use the power of Honeycomb with metrics. Sending infrastructure metrics data to Honeycomb has always been possible, but with our focus on debugging the user experience inside the application, it isn’t the first or most obvious thing to do. This post will discuss why we use metrics in general and how to think about metrics in Honeycomb.
Log Sampling is a powerful feature introduced in HAProxy 2.0 that lets you define a percentage of your logs to create a representative view of your data allowing you to minimize your costs. Log files are the key to observability. They can provide helpful information that can be used for debugging as well as analytics that can be used to understand how users interact with an application.