Observability Platform Demo
Logz.io collects your logs, metrics, and traces in the same place so you can seamlessly jump between each data type to investigate problems faster than ever.


The latest News and Information on Observabilty for complex systems and related technologies.
Monitoring vs observability – is there even a difference and is your monitoring system observable? Observability has gained a lot of popularity in recent years. Modern DevOps paradigms encourage building robust applications by incorporating automation, Infrastructure as Code, and agile development. To assess the health and “robustness” of IT systems, engineering teams typically use logs, metrics, and traces, which are used by various developer tools to facilitate observability.
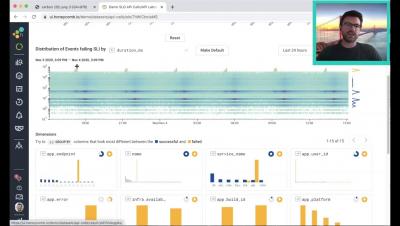
I’ve recently started working on a new project to build a Discord bot in Go, mostly as a way to learn more Go but also so I can use it to manage various things in Azure and potentially elsewhere. I figured it’d be useful to document some of this project to give some insights as to what I’ve done and why. Next up is the bot itself and how I integrated it into Honeycomb to get some visibility on how different commands are running.
The shift to Observability Over the last six months, unified monitoring, log management, and event management vendors have reoriented their technology portfolios (often without any change to the underlying functionality) towards Observability. In so doing, a fair amount of confusion has been generated in the market.
At Google Cloud, we strive to bring Site Reliability Engineering (SRE) culture to our customers not only through training on organizational best practices, but also with the tools you need to run successful cloud services. Part and parcel of that is comprehensive observability tooling—logging, monitoring, tracing, profiling and debugging—which can help you troubleshoot production issues faster, increase release velocity and improve service reliability.
Three years ago, Tom Wilkie and Frederic Branczyk sketched out the idea for Prometheus monitoring mixins. This is a jsonnet-based package format for grouping and distributing logically related Grafana dashboards with Prometheus alerts and rules. The premise was that the observability world needed a way for system authors to not only emit metrics, but also provide guidance on how to use those metrics to monitor their systems properly.