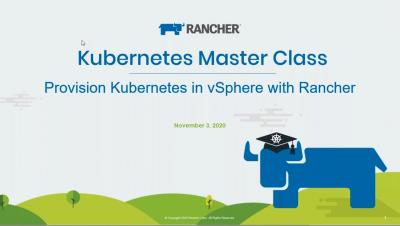
Operations | Monitoring | ITSM | DevOps | Cloud

VMware

How to Report on Remote Worker Productivity

Learn how Goliath can help you better document the end-user productivity experience for your home workers using Citrix or VMware Horizon with: end-user productivity and activity reports, experience reports tracking logon speeds and other KPIs, overall IT performance for host, VMs, and storage.

Kubernetes Master Class - Provision Kubernetes in vSphere with Rancher

vSphere continues to be a popular destination for Rancher-provisioned Kubernetes clusters. In this Master Class, Rancher Staff Software Engineer, Luther Monson and Field Engineer, David Holder present updates on the capabilities of Rancher with vSphere. Follow along with a full cluster lifecycle demonstration showcasing template creation, provisioning, cloud providers and more.

Provisioning and Managing Tanzu Kubernetes Clusters on vSphere 7 from VMware Tanzu Mission Control

We are excited to announce integration between Tanzu Mission Control and Tanzu Kubernetes Grid Service, a component of vSphere 7 with Tanzu. With this integration, customers can centrally provision and manage the lifecycle of Tanzu Kubernetes clusters on vSphere 7 across multiple vCenter Server instances and/or multiple data centers via Tanzu Mission Control.

How to collect VMware vSphere metrics

In Part 1 of this series, we discussed key VMware vSphere metrics you can monitor to help ensure the health and performance of your virtual environment. In this post, we’ll cover how you can access these key vSphere metrics using a few of VMware’s internal monitoring tools. We’ll also show you how and where to access VMware events and logs to help you gain further insight into your virtual environment.

How to monitor vSphere with Datadog

In Part 2 of this series, we looked at how to use vSphere’s built-in monitoring tools to get insight into core components of your vSphere environment, including virtual machines and their underlying hardware. Next, we’ll show you how to use Datadog to get complete end-to-end visibility into the physical and virtual layers of your vSphere environment.

Key metrics for monitoring VMware vSphere

VMware’s vSphere is a virtualization platform that allows users to provision and manage one or more virtual machines (VMs) on individual physical servers using the underlying resources. With vSphere, organizations can optimize costs, centrally manage their infrastructure, and set up fault-tolerant virtual environments.

vExpert Shares How to Troubleshoot VMware Horizon is Slow Complaints

Hear vExpert, Johan van Amersfoort and Goliath explain how to monitor and troubleshoot: logons are slow and drill down into the various stages to identify if the root cause is within the client validation, authentication, group policy processing, profile loading, or interactive session stage. Session performance is slow and determine if the core issue is with session network latency, server TCP load, or within the presentation layer negatively impacting PCoIP/BLAST round trip times, and new VDI implementations and migrations enabling admins to anticipate and prevent end-user performance issues leveraging embedded intelligence and automation.

vSphere 7 with Tanzu Integrates with HAProxy for Load Balancing Enterprise-grade Kubernetes

VMware chose HAProxy as the default load balancer for Tanzu Kubernetes clusters, which helped streamline load balancing in their Kubernetes platform. VMware has delivered vSphere 7 with Tanzu, its endeavor to embed an enterprise-grade version of Kubernetes inside vSphere, the industry-leading compute virtualization platform.