How to install collectd and send metrics to MetricFire
This is a tutorial on setting up collectd on Linux, sending metrics to MetricFire, and creating a Grafana dashboard with those metrics.


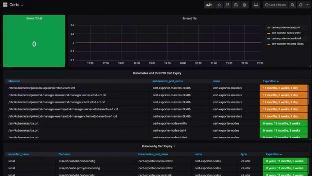
Certificates can be difficult to track and opaque to administrators, and if any expire without someone noticing, embarrassing outages can happen. At Grafana Labs we strive to make all things visible and observable; why should certificates be any exception? In this post we will explore an easy way to expose and monitor certificate expirations using Grafana and Prometheus.
While powerful, our first iteration of Discover had some user experience complexities that made it less user-friendly than other potential search mechanisms. We also heard from you that our Events feature was useful for identifying individual events, but finding common patterns within those events was extremely difficult — keyword, ”was”. I want to share some of the features and the top 5 use cases that you can do with the refreshed Discover.
If you haven’t yet heard...Splunk dashboards are new and improved! We released a new dashboard framework as a beta app at .conf19, and have been working hard to improve it since then. This blog post will cover the highest-impact features in the release. For notes on every feature, see the release notes on Splunkbase. To see a run-anywhere dashboard highlighting the key features from this release, copy the JSON definition from our Github.
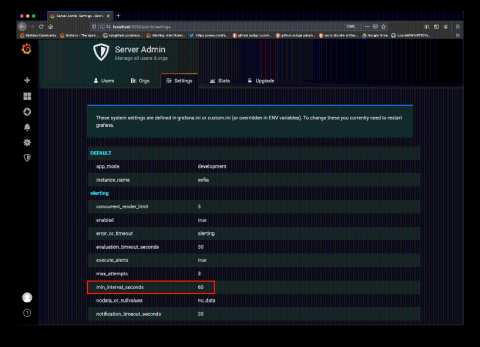
There has long been a request from administrators to have the ability to enforce a minimum interval between alert rule evaluations. This is useful for restricting unrealistic user-defined alert rules that evaluate too often and create unnecessary load in the backend. @Uepoch took the initiative and made all the necessary modifications for this configuration in Grafana’s backend, and we finally pushed it forward and introduced the feature in Grafana v6.6.
We are excited to announce the release of new versions of our two flagship products: SquaredUp for Azure version 4.5 and SquaredUp for SCOM version 4.5. Our product engineering teams have been working hard on the first big update since the launch of SquaredUp for Azure in November 2019, and have added some great new features and improvements based on customer feedback, including these beautiful cost visualizations…
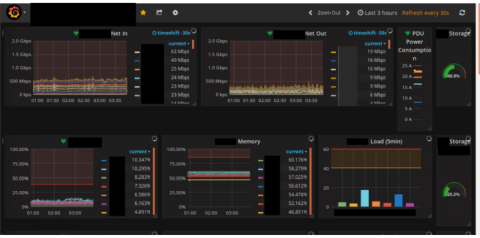
Stefano Mitchell is a customer support engineer at SkySilk Cloud Services. It’s no secret that there is a correlation between a team having quick access to metrics and swift resolutions. Accurate monitoring metrics displayed in a clear and efficient manner help your teams respond to alerts and issues as they arise in real time. SkySilk Cloud Services, a cloud services provider, uses Grafana dashboards internally to maintain a strong overview of regional system health.
Grafana dashboards can do a lot, but do you know how much more you can get out of them by configuring them as code? That was the topic of a recent FOSDEM 2020 talk by Grafana software developer Malcolm Holmes and Julien Pivotto, an open source consultant at Inuits. In their presentation, the pair discussed Grafonnet (a Jsonnet library to generate Grafana dashboards), provided tips and tricks about how to use it efficiently, and explained how to fully manage your Grafana instances from code.
In a previous post we showed how to install Prometheus and Grafana using the prometheus-ksonnet library along with Tanka. This is great for getting a well-managed monitoring install going, but sometimes it isn’t enough for monitoring larger clusters. If you have multiple clusters that you want to monitor on a single dashboard, or need long-term storage, or need a high-availability setup for your monitoring data, then this installation won’t be sufficient on its own.