Azure Active Directory SSO with OAuth for Grafana
Quick configuration of Azure active directory sso login for Grafana.


84.51°, the data analytics and marketing company owned by The Kroger Company, found out it needed centralized metrics the hard way. When Erin O’Brien was brought into the company in the spring of 2019 as a Lead Service Manager, she was tasked with evaluating and seeking ways to continuously improve how the Technology and Product teams worked together.
The Grafana 6.6 stable release includes improvements to Alerting, CloudWatch, Explore, Loki, Graphite, Stackdriver, and more.
Welcome to 2020! (We’re a little slow with that on the Loki team.) To kick off the year we are releasing Loki 1.3! Anyone running Loki in microservices mode will be excited by this release as it introduces the Loki Query Frontend. (If you aren’t using microservices, be patient – good things will be coming your way soon.) The query frontend sits in front of the queriers and allows sharding queries based on time.
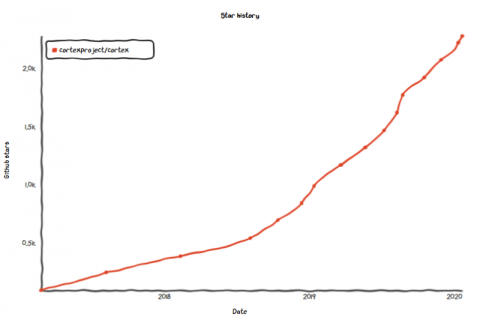
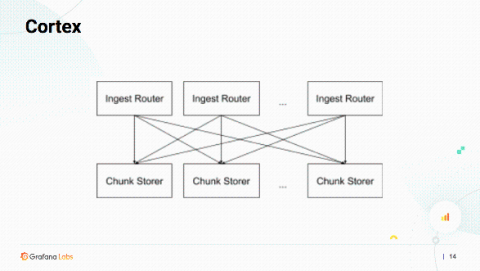
The Cortex project, a horizontally scalable Prometheus implementation and CNCF project, is more than three years old and shows no sign of slowing down. Right now, there are a lot of things going on in Cortex, but sometimes it’s not clear why we’re doing them. So I want to provide some clarity for both the Cortex community – and the wider Prometheus community – regarding our intentions, especially with regards to the Thanos Project.
As the open-source monitoring system Prometheus grew, so did the need to grow its capacity in a way that is multi-tenant and horizontally-scalable, along with the ability to handle infinite amounts of long-term storage. So in 2016, Julius Volz and Tom Wilkie (who is now at Grafana Labs) started Project Frankenstein, which was eventually renamed Cortex.
You probably missed it. Don’t feel bad. It was just one small paragraph, buried in the GitLab 11.9 Omnibus Release Notes: Grafana is now bundled in our Omnibus package, making it easier than ever to understand how your instance is performing. “Omnibus” is what GitLab calls its main installation package, and “Grafana” is the time-series visualization software, but what does this paragraph even mean?
About a year ago, in another Pandora FMS blog, we talked about what Grafana is, we explained what it was and how it was related to other software. Now we go a little further and we want to show you how to create Grafana dashboards with the data provided by Pandora FMS. It is undeniable that this tool enjoys the support of a large user community, due to the versatility it offers to use different data sources to have displayed on its boards.
Grafana by default uses sqlite3 as a local database to hold the configuration information (such as users, dashboards, alerts, etc.). But did you know you can also use other databases for this purpose? Many large customers prefer to use either Postgresql or MySQL/MariaDB, and we recently had a request from a company wanting some help to migrate their configuration data from Postgresql to MySQL. This is not a common request, so we didn’t have any pre-existing tooling to do it.
YAML sucks! This blog post explains why existing tools hardly ease this pain, and what we at Grafana Labs did about it with our new project, Tanka.