Operations | Monitoring | ITSM | DevOps | Cloud

Dashboards

The Leading Reporting Dashboard Examples

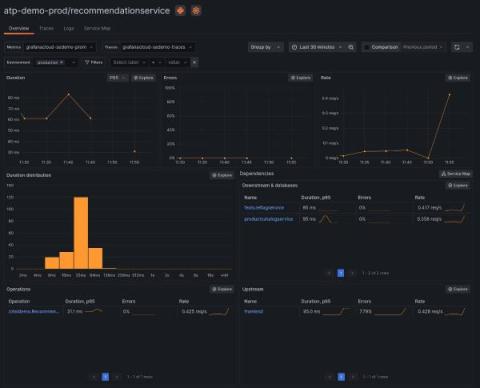
Dashboards provide an enhanced view of your most critical business metrics. With the majority utilizing both real-time and historical data, they enable you to promptly respond to current trends as well as accurately forecast for the future. Also, reporting dashboards excel when compared to static reports, in regards to presenting data and objectives to stakeholders.

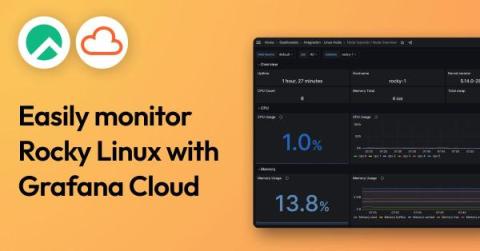
Easily monitor your Rocky Linux server using the Linux integration for Grafana Cloud

Rocky Linux is a community-driven, open source operating system that is backed by CIQ, the primary sponsor and support provider. This OS is a powerful alternative for those seeking a downstream, binary-compatible option to Red Hat Enterprise Linux (RHEL). CIQ supports Rocky Linux as a response to changes in the CentOS project, which is no longer maintained as a stable downstream clone of RHEL.

AI-powered diagnostics for incident response: New Sift features in Grafana IRM

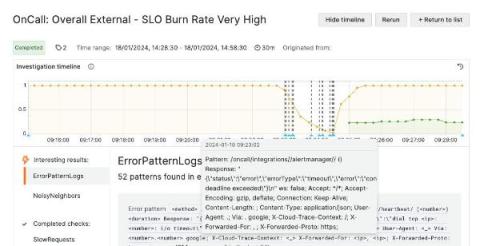
Sift is a machine-learning-powered diagnostic feature in Grafana Cloud that SREs and DevOps teams can use to automate routine parts of incident investigation, such as searching for new errors in logs, surfacing recent deployments, or identifying overloaded Kubernetes nodes. We want Sift to springboard you into an investigation, so useful context is already there by the time you see an alert or declare an incident.

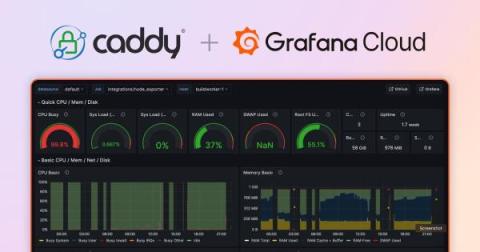
How the open source Caddy server uses Grafana Cloud for full-stack observability

Mohammed Al Sahaf serves as Technical Product Manager at Samsung Electronics Saudi Arabia. Outside his day job, he serves with the Caddy team to tackle the web of problems facing web servers in the third millennium. Mohammed is the author of Kadeessh, formerly caddy-ssh, and the maintainer of numerous Caddy modules. When he isn’t programming, he is trying to catch up on life and sleep with the help of coffee.

How to instrument your Python application using OpenTelemetry

If you want to see if OpenTelemetry helps you become a better Python developer — or if you just want to know how to add OpenTelemetry to your Python service — you’ve come to the right place. In this blog, we’ll show you how to instrument your Python application using OpenTelemetry and how to visualize your OpenTelemetry data using Application Observability in Grafana Cloud. We’ll walk you through the following steps.

OpenTelemetry: 3 questions to ask before choosing an observability solution

As OpenTelemetry rises in popularity, more organizations are implementing, or planning to implement, the open source project to monitor their applications — and, meanwhile, more vendors are offering OpenTelemetry support. In fact, a quick Google search for “OpenTelemetry support” shows results ranging from legacy APM vendors to newer, cloud native solutions like Grafana Cloud.