Operations | Monitoring | ITSM | DevOps | Cloud

Datadog

Monitor Windows event logs with Datadog

Whenever an event occurs on your Windows machine, the operating system records an event log that includes details about the nature of the event (e.g., critical runtime error) or security identifiers (for audit events). Windows event logs not only record system and application activity but also user actions and background processes, making them an invaluable tool for monitoring the security and health of your systems.

Best practices for monitoring CDN logs

By storing copies of your content in geographically distributed servers, content delivery networks (CDNs) enable you to extend the reach of your app without sacrificing performance. CDNs lessen the demand on individual web hosts by increasing the number and regional spread of servers that are able to respond to incoming requests for cached content. As a result, they can deliver web content faster and provide a better experience for your end users.

Troubleshoot with Kubernetes events

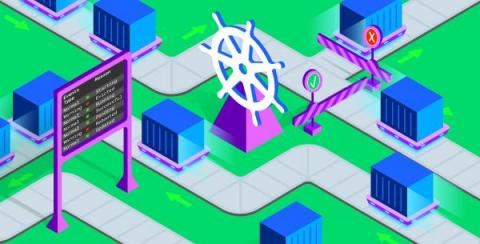
When Kubernetes components like nodes, pods, or containers change state—for example, if a pod transitions from pending to running—they automatically generate objects called events to document the change. Events provide key information about the health and status of your clusters—for example, they inform you if container creations are failing, or if pods are being rescheduled again and again. Monitoring these events can help you troubleshoot issues affecting your infrastructure.

Monitor network access with Twingate's offering in the Datadog Marketplace

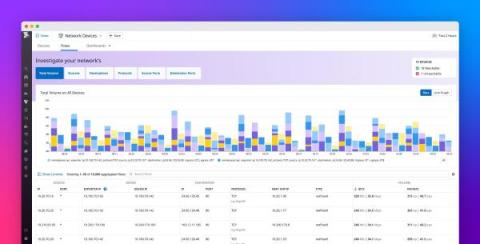
Twingate is a network access platform that enables customers to deploy a zero trust authentication layer with their infrastructure as code (IAC) provider of choice. Using this model, you can program strict access control rules that can be updated and co-deployed alongside changes to your infrastructure. Each time a user establishes or closes a connection to a resource, Twingate documents the event with details such as the port, the volume of data transferred, and user identification.

Quickly and securely enable monitoring for your entire Google Cloud environment

A foundational component of monitoring Google Cloud environments with Datadog is our Google Cloud Platform integration. This integration continuously collects metrics from all of your Google Cloud services and enriches them with tags, enabling you to scope dashboards and monitors to the relevant resources and seamlessly pivot across logs, metrics, and traces inside the Datadog platform.

Monitor GitLab with Datadog

GitLab is a DevSecOps platform that helps engineering teams automate software delivery. Using GitLab, teams can easily collaborate on projects and quickly deliver application code with robust CI/CD, security, and testing features. Datadog’s GitLab integration enables you to monitor your GitLab instances alongside the rest of your infrastructure by collecting GitLab metrics, logs, and service checks.

Monitor machine learning models with Fiddler's offering in the Datadog Marketplace

With the growing utilization of AI, modern business applications rely more and more on machine learning (ML) models. But the complexity of these models poses significant challenges to data scientists, engineers, and MLOps teams seeking to maintain and optimize performance.

Use CIDR notation queries to filter your network traffic logs

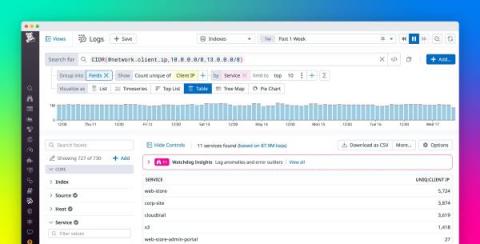
Classless Inter-Domain Routing (CIDR) is the dominant IP addressing scheme in the modern web. By enabling network engineers to create subnets that encapsulate a set range of IP addresses, CIDR facilitates the flexible and efficient allocation of IPs in virtual private clouds (VPCs) and other networks.