Operations | Monitoring | ITSM | DevOps | Cloud

The Place Where Modern Operations & Technology Come Together



Cloud Monitoring: What It Is & How Monitoring the Cloud Works
One of the primary goals of any IT team is to ensure seamless operation and consistent uptime. This is typically achieved via monitoring — whether on-premises, in an application or across a network, monitoring allows teams to respond quickly to a given issue or even understand potential problems before they arise. For today’s complex distributed systems, one of the more common monitoring methods comes in the form of cloud monitoring.
Splunk Achieves AWS Retail Competency Status
Modern retail businesses need to deliver exceptional customer experiences that are not only fast and secure but also completely frictionless. Amazon Web Services (AWS) and Splunk have come together to provide a value proposition that goes beyond what either platform can offer independently.
Correlation Does Not Equal Causation - Especially When It Comes to Observability [Part 1]
Observability has been tied up with causality from its origins in the mathematical realm of control theory in the early 1960s. A system (of any kind, hardware or software, natural or engineered) was deemed to be ‘observable’ if it generated self-descriptive data from which it was possible to infer how states of the system were causally related to one another.
Observability for the Public Sector: Greater Visibility for a More Resilient Digital Future
Observability continues to prove its worth. In The State of Observability 2023, the annual research report Splunk created in partnership with the Enterprise Strategy Group, we share the characteristics that set the observability leaders (those with a mature observability practice) apart from the rest.

Failure Metrics & KPIs for IT Systems
The game in enterprise IT is this: delivering amazing services to your customers while also reducing costs. That means the time it takes to respond to an incident is critical. Incidents can ruin service delivery and destroy your budget. Certain incidents almost surely deliver a poor customer experience. Response times, you hear? Yep, we’re talking about MTTR, but that’s not all.
Your Self-Managed Journey to Digital Resilience
If you were one of the thousands of Splunk customers who joined us this year at.conf23, you heard our CEO Gary Steele say that Splunk's mission is to help you be digitally resilient. (And don't worry if you couldn't join us, because you can catch the keynote replays.) But what is digital resilience and how do you attain it?

SLA vs. SLI vs. SLO: Understanding Service Levels
In our service-driven world, businesses must provide the best user experience possible. Great service helps you retain long-term customers while also growing your customer base — to keep tabs on service performance, a few key metrics and signals come into play.
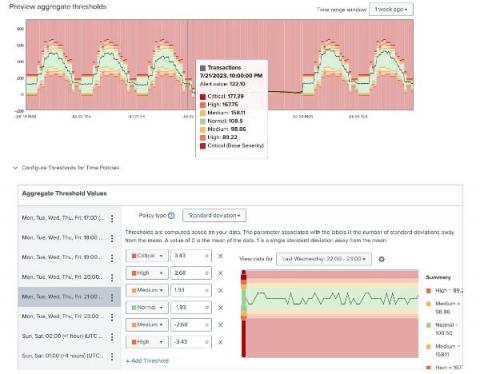
Breaking Through the Threshold: Leveling up ITSI Adaptive Thresholding with Splunk AI
Adaptive thresholding is a key capability in Splunk IT Service Intelligence (ITSI) that enables customers to dynamically monitor the status of their key performance indicators (KPIs) and derive meaningful service insights and alerts.
Dashboard Studio: How to Configure Show/Hide and Token Eval in Dashboard Studio
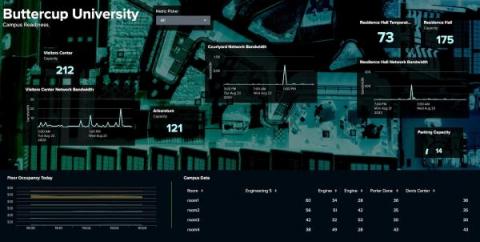
You may be familiar with manipulating tokens via `eval` or `condition`, or showing and hiding panels via `depends` in Classic (SimpleXML) dashboards, and wondering how to do that in Dashboard Studio. In this blog post, we'll break down how to accomplish these use cases in Dashboard Studio, using the same examples that were shown at.conf23.