Operations | Monitoring | ITSM | DevOps | Cloud

A Snapshot of our IT Ops Predictions for 2023

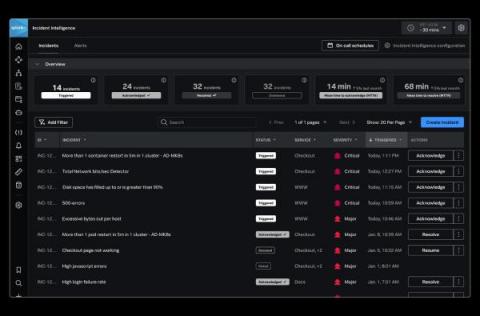
Today executives and customers expect IT and digital services to be available and performant at all times; compromised availability or performance is no longer tolerable. Think about it; when was the last time a digital service was unavailable and it didn’t make the news or social media? When was the last time you visited a website that was unavailable and you waited for the outage to be over, rather than finding an alternative in the moment?

Communicating Context Across Splunk Products With Splunk Observability Events

When an IT or Security issue impacts a development team’s software how are they notified? Is your organization still relying on mass emails that lack context and most engineers have probably already filtered out of their inbox? Communicating between siloed tools and teams can be difficult. How would you like to put IT, Security, legacy processes, and business notifications specific to development teams right into one of their most important tools? Now you can!

Observability to Modernize Apps and Increase Business Resilience

Increasingly, the speed and scale of a business can be measured by the resilience and performance of its applications. That’s why organizations are opting to modernize legacy applications by rewriting them using cloud-native tools and platforms. A Gartner study found that by 2025, cloud-native platforms will be the foundation for more than 95% of new digital initiatives, compared to less than 40% in 2021.

Introduction to Splunk Log Observer

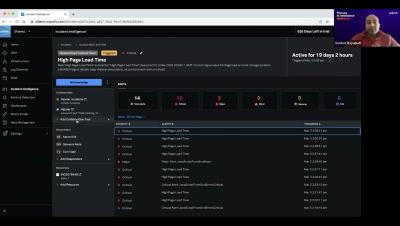
This video provides an overview of Splunk Log Observer. See use cases for Splunk Log Observer, and how to send log data to Splunk Log Observer. Learn Log Observer concepts such as filtering and browsing log messages, finding trends in log data through aggregation functions, and facilitating team collaboration through saved queries. See examples of how to navigate Splunk Log Observer and how to use Log Observer for root cause analysis.

CMDBs Explained: How To Maximize Value from Configuration Management Databases

For many IT organizations, having complete end-to-end visibility of their IT assets as well as a comprehensive understanding of integrations, dependencies and changing statuses is an ideal position rather than a reality. This is especially true for organizations with legacy on-premises systems spread across many environments. Those that were cloud native or successfully migrated to the cloud had the privilege of cloud tools to visualize individual environments.

Optimize Application Performance with Code Profiling

When monitoring your application performance or troubleshooting an issue in production, context is key. The more information available, the faster the prevention of or detection of a user impacting issue. Observability tools offer many different features, like code profiling, to help contextualize your data. In this post, I’ll discuss what code profiling is and show an example of how it works.

Logs vs Metrics: Pros, Cons & When to Use Which

As we at Splunk accelerate our cloud journey, we’re often faced with the decision of when to use logs vs metrics — a decision many in IT face. On the surface, one can do a lot by just observing logs and events. In fact, in the early days of Splunk Cloud, this is exactly how we observed everything. As we continue to grow, however, we find ourselves using a combination of both. This post lays out the overall difference in logs and metrics and when to best utilize each.