Operations | Monitoring | ITSM | DevOps | Cloud

Elastic

Logging for public sector: How to make the most of your mission-critical data

With governments doubling down on logging compliance, many public sector organizations have been focusing on optimizing their log management, especially to ensure they retain logs for required periods of time. Logs — though seemingly straightforward — are the backbone of many mission-based use cases and therefore have the potential to accelerate mission success when centrally organized and leveraged strategically. In public sector, logs are instrumental in.

Root cause analysis with logs: Elastic Observability's AIOps Labs

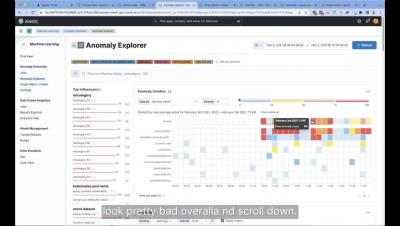
In the previous blog in our root cause analysis with logs series, we explored how to analyze logs in Elastic Observability with Elastic’s anomaly detection and log categorization capabilities. Elastic’s platform enables you to get started on machine learning (ML) quickly. You don’t need to have a data science team or design a system architecture. Additionally, there’s no need to move data to a third-party framework for model training.

Log monitoring and unstructured log data, moving beyond tail -f

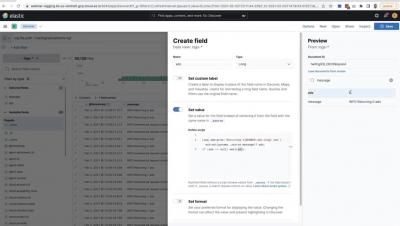
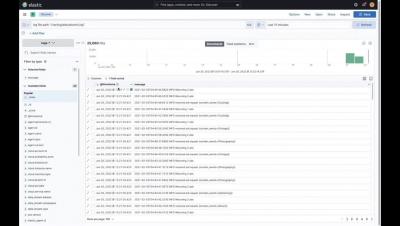
Log files and system logs have been a treasure trove of information for administrators and developers for decades. But with more moving parts and ever more options on where to run modern cloud applications, keeping an eye on logs and troubleshooting problems have become increasingly difficult. Watch this video to learn how to go beyond tail -f and process custom and unstructured logs with Elastic.

How to add support for more languages in your Elastic Enterprise Search engines

Engines in Elastic App Search enable you to index documents and provide out-of-the-box, tunable search capabilities. By default, engines support a predefined list of languages. If your language is not on that list, this blog explains how you can add support for additional languages. We’ll do this by creating an App Search engine that has analyzers set up for that language.

Monitoring service performance: An overview of SLA calculation for Elastic Observability

Elastic Stack provides many valuable insights for different users. Developers are interested in low-level metrics and debugging information. SREs are interested in seeing everything at once and identifying where the root cause is. Managers want reports that tell them how good service performance is and if the service level agreement (SLA) is met. In this post, we’ll focus on the service perspective and provide an overview of calculating an SLA.

Elastic Common Schema and OpenTelemetry - A path to better observability and security with no vendor lock-in

At KubeCon Europe, it was announced that Elastic Common Schema (ECS) has been accepted by OpenTelemetry (OTel) as a contribution to the project. The goal is to achieve convergence of ECS and OpenTelemetry’s Semantic Conventions (SemConv) into a single open schema that is maintained by OpenTelemetry. This FAQ details Elastic’s contribution of Elastic Common Schema to OpenTelemetry, how it will help drive the industry to a common schema, and its impact on observability and security.

Using Elastic Anomaly detection and log categorization for root cause analysis

Elastic's machine learning helps support several easy-to-use features to help determine root cause analysis for logs. This includes anomaly detection and log categorization, which are easy-to-use features aiding in analysis without the need to understand or know about machine learning.

Monitor OpenAI API and GPT models with OpenTelemetry and Elastic

ChatGPT is so hot right now, it broke the internet. As an avid user of ChatGPT and a developer of ChatGPT applications, I am incredibly excited by the possibilities of this technology. What I see happening is that there will be exponential growth of ChatGPT-based solutions, and people are going to need to monitor those solutions.