Auvik Launches Network Traffic Flow Analytics for MSPs
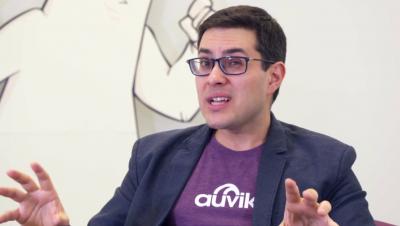
Alex Hoff, Chief Product Officer at Auvik Networks, announces the launch of Auvik TrafficInsights, Auvik’s new NetFlow feature.


In this blog post we will go through how you can create plugins for Grafana using ReactJS. This presumes you have some basic knowledge about writing components in React.
An important element of operating Kubernetes is monitoring. Hosted Kubernetes services simplify the deployment and management of clusters, but the task of setting up logging and monitoring is mostly up to us. Yes, Kubernetes offer built-in monitoring plumbing, making it easier to ship logs to either Stackdriver or the ELK Stack, but these two endpoints, as well as the data pipeline itself, still need to be set up and configured.
Amazon Elastic Load Balancing ( ELB ) allows you to create load balancers for your application without having to actually manage the servers that do the load balancing. However, since it’s a managed service, you have less visibility with traditional monitoring tools. As such, it becomes even more important to take advantage of the available monitoring tools in AWS. In this post, we’ll explain how to use CloudWatch to monitor Elastic Load Balancing and what is important to watch.
Sentry recently experienced two minor outages related to database lock-contention: a situation where a process stops executing as it waits on another to release a shared resource they each depend on. It’s kind of like [insert comical metaphor intended to inspire a light-hearted chuckle here].
The StatsD stack is one of the most popular monitoring solutions to instrument your code using custom metrics. In this post we will describe the StatsD metrics architecture, metrics types and formats, proving code examples for the Golang, NodeJS/Javascript and Python programming languages.
Have you wanted to throw away your expensive internet bill and use your neighbor's insecure wifi? Was the only thing holding you back the Honeybadger single-factor auth flow? Well, have I got news for you.