Grafana Cloud is the easiest way to get what you need for observability: Prometheus and Graphite for metrics, Loki for logs, and Tempo for tracing, all integrated within Grafana and managed by the Grafana Labs team. You can go from zero to beautiful graphs, insightful logs, and preconfigured alerts in minutes. Built with modern distributed systems techniques, Grafana Cloud allows you to grow with your applications and infrastructure and easily scale past 100M+ metrics.
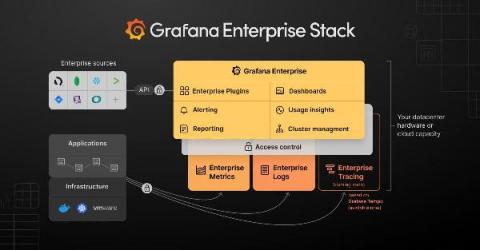
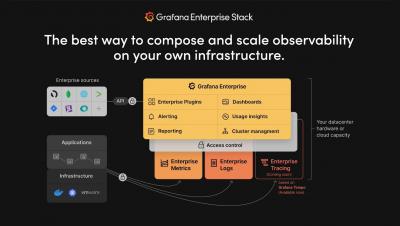
Today, we are launching a new Grafana Labs product, Grafana Enterprise Logs. Powered by the Grafana Loki open source project for cloud native log aggregation, and built by the maintainers of the project, this offering is an exciting addition to our growing self-managed observability stack tailored for enterprises.
In this post, we’re going to talk about tips for securing the reliability of Loki’s write path (where Loki ingests logs). More succinctly, how can Loki ensure we don’t lose logs? This is a common starting point for those who have tried out the single binary Loki deployment and decided to build a more production-ready deployment. Now, let’s look at the two tools Loki uses to prevent log loss.
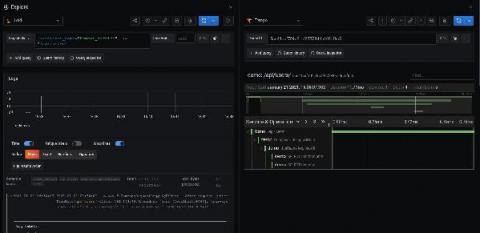
OpenTelemetry is a CNCF project that standardizes observability (logs, metrics, and traces) across many languages and tools. Today we will look at how we can use the OpenTelemetry .NET library to instrument a .NET 5.0 web API, to offload traces to Tempo and logs to Loki in Grafana Cloud. Grafana Cloud now has a free plan. Set up your account and follow along!
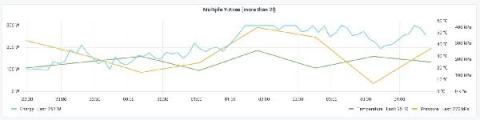
In Grafana 7.0, we introduced a new panel architecture to enhance the UX and visualization options and create a more consistent experience across Grafana. In Grafana 7.4, we expanded on that foundation and introduced the next-generation graph panel called Time series panel, which is currently in beta. The Time series panel uses the panel architecture of Grafana 7.0 and integrates with field options, overrides, and transformations.
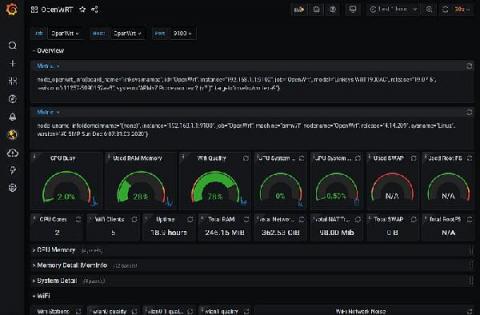
I’ve been an open source fan and user for many, many years, going back to before we defined the term “open source” and we called it “free software.” Whenever and wherever possible I prefer to have control over the software I run on my devices. Case in point: My internet router runs OpenWrt, which is a free/open source Linux operating system designed to replace the software provided by the router’s manufacturer.
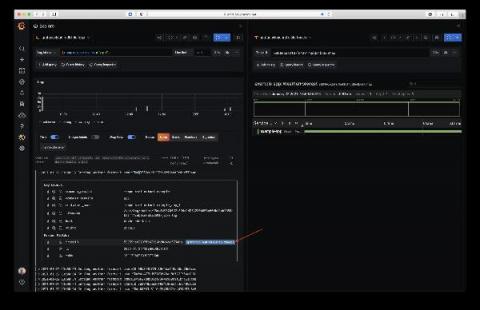
Hey there! This is Éamon Ryan from the Solutions Engineering team. Very recently the Splunk data source plugin, which is available with a Grafana Enterprise license, had a new release: v2.1.0. While it added a few good bug fixes for edge cases, the biggest change, I think, was the addition of support for data links! Data links actually show up in a few places inside Grafana.
Grafana v7.4 has been released! The big news for Grafana 7.4 is the next-generation graph panel called time series, which is in beta. A high-performance visualization based on the uPlot library, it uses the new panel architecture introduced in Grafana 7.0 and integrates with field options, overrides, and transformations.
Auto-instrumentation is a subject I have not had much experience with. Here at Grafana Labs, we primarily develop in Go, which doesn’t afford such luxuries. However, there is an enormous amount of interest from the community in Java auto-instrumentation, so I set out to determine what was possible using the shiny new OpenTelemetry auto-instrumentation libraries.