Operations | Monitoring | ITSM | DevOps | Cloud

Grafana

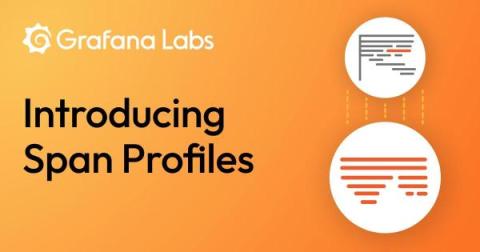
Combining tracing and profiling for enhanced observability: Introducing Span Profiles

In today’s complex data landscape, continuous profiling has become essential for detailed insights into application resource usage. Grafana Labs is now advancing this field with the introduction of Span Profiles in Grafana 10.3. The Span Profiles feature represents a major shift in profiling methodology, enabling deeper analysis of both tracing and profiling data. Traditional continuous profiling provides a system-wide view over fixed intervals.

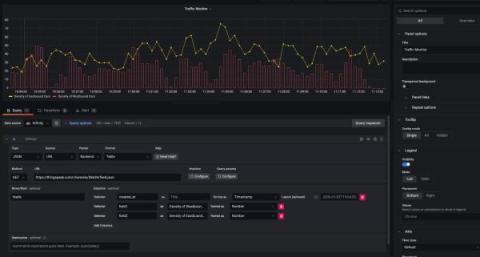
Infinity plugin for Grafana: Grafana Labs will now maintain the versatile data source plugin

Grafana was initially renowned for its ability to help users visualize time series data for platforms like Graphite and Elasticsearch. However, as the landscape evolved, demand surged for Grafana to embrace a wider array of data formats, particularly from third-party APIs.

Visualize Sumo Logic metrics and logs with Grafana: Introducing the Sumo Logic Enterprise plugin

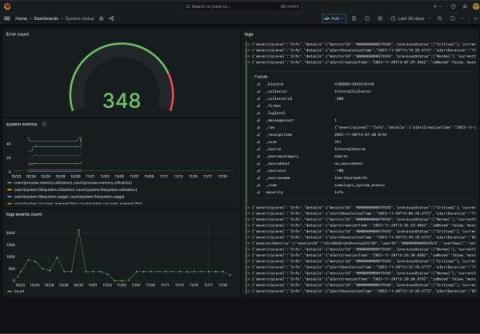
We are thrilled to announce the addition of a powerful new Enterprise plugin in the Grafana ecosystem: the Sumo Logic Enterprise data source plugin for Grafana. You can now easily connect Sumo Logic to your Grafana instance and correlate your log data with telemetry from all your data sources in one unified Grafana dashboard.

OpenTelemetry and Grafana Labs: What's new and what's next

A new year is a natural time to reflect on past achievements — and consider future aspirations. When I think about the observability space, specifically, in 2023, OpenTelemetry felt omnipresent. It was a hot topic at every industry event, with at least one dedicated talk at ObservabilityCON, Monitorama, PromCon, and KubeCon + CloudNativeCon, both NA and EU. A notable highlight from KubeCon was OpenTelemetry going GA, marking a significant milestone in the project’s development.

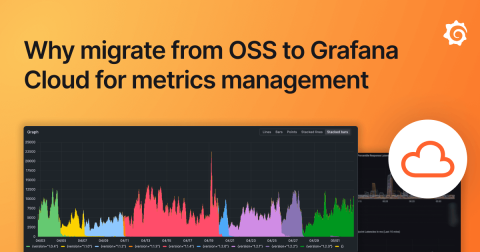
Why companies migrate from OSS to Grafana Cloud for metrics management

In 2022, we introduced Grafana Mimir, the most scalable and performant open source time series database in the world. And since its launch, we’ve been busy, increasing Mimir’s scale, making it easier to get started, and boosting query performance. But even with these advancements, we understand the challenges that can come with a self-hosted and self-managed OSS tool.

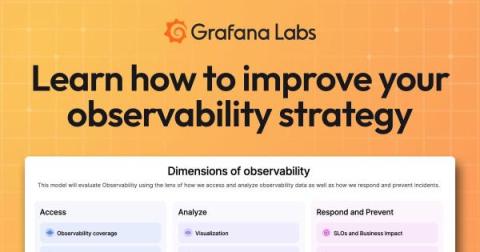
How to improve your observability strategy: Introducing the Observability Journey Maturity Model

While many segments of the IT market move quickly, the observability space seems to move at lightning speed. Fueled by open source innovation, observability toolsets and best practices constantly evolve. Sometimes, it can be tough to keep up — and even tougher to know where your own observability strategy stands. That’s the exact challenge we aim to address with our new Observability Journey Maturity Model.

Inside TeleTracking's journey to build a better observability platform with Grafana Cloud

Oren Lion, Director of Software Engineering, Productivity Engineering, and Tim Schruben, Vice President, Logistics Engineering, both work for TeleTracking, an integrated healthcare operations platform provider that is Expanding the Capacity to Care™ by helping health systems optimize access to care, streamline care delivery, and connect transitions of care.

Getting started with Application Observability for Java

Links: Description: Get started with instrumenting Java applications with Grafana Cloud to observe them, detect anomalies, and find root causes. In this video, Grafana Developer Advocate Leandro Melendez outlines how to quickly get started with Application Observability for Java based on these three easy steps: Download the Grafana instrumentation agent Instrument an application and send telemetry data to the Grafana Cloud OTLP Endpoint Observe the service in Application Observability.

How to manage Grafana instances within Kubernetes

If you’re using Grafana and Kubernetes, we’ve got exciting news — Grafana Labs will be maintaining and managing the Grafana Operator, the open source Kubernetes operator that helps you manage your Grafana instances within and outside of Kubernetes. This significant move not only elevates the Grafana Operator to an officially supported tool but also cements its place as a staple for managing Grafana as code, especially for users keen on adopting GitOps principles.