Operations | Monitoring | ITSM | DevOps | Cloud
Tracing
The latest News and Information on Distributed Tracing and related technologies.
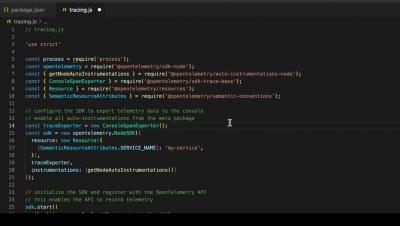
OTEL Me More: A quick start guide to OpenTelemetry-JS and Express
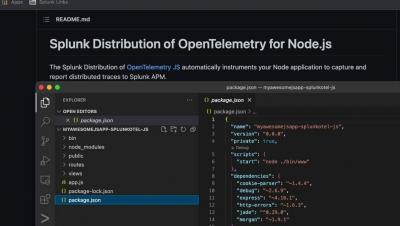
OTEL Me More: Splunk-OTEL-JS and Express emitting to an OTEL Collector
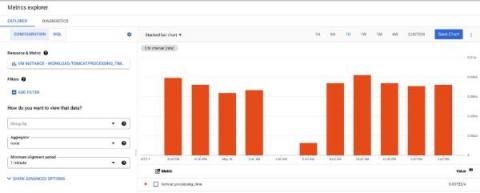
How to Reduce Data Costs with OpenTelemetry and BindPlane OP
The future of OpenTelemetry | Q&A
Current state of OpenTelemetry and how it fits in the DevOps ecosystem | Q&A
4 Ways to reproduce issues in microservices
Let’s say we have an issue in production. We’ve all been there, right? The first thing we want to be able to do is reproduce the issue. By reproducing, we can confirm it’s a recurring issue, rather than a sporadic one, and that it requires a fix to ensure that our product is working properly. When shifting from a monolith to microservices, reproducing issues becomes more of a challenge.
Tracing Troubleshooting
How to use OpenTelemetry for Kafka Monitoring
Apache Kafka is a high-throughput, low-latency platform for handling real-time data feeds. Its storage layer is in essence a massively scalable pub/sub message queue designed as a distributed transaction log. It can be used to process streams of data in real-time, building up a commit log of changes. Kafka has strong ordering guarantees that enable it to handle all sorts of dataflow patterns including very low latency messaging and efficient multicast publish / subscribe.
Running the OpenTelemetry Collector in Azure Container Apps
In this post, we’ll look at how to host the OpenTelemetry Collector in Azure Container Apps. There are a few gotchas with how it’s deployed, so hopefully this will stop you from hitting the same issues. If you don’t care about the details and just want to run a script, I’ve created one here.


