Operations | Monitoring | ITSM | DevOps | Cloud
Tracing
The latest News and Information on Distributed Tracing and related technologies.
Micro Lesson: Span Analytics
Intro to distributed tracing with Tempo, OpenTelemetry, and Grafana Cloud
I’ve spent most of my career working with tech in various forms, and for the last ten years or so, I’ve focused a lot on building, maintaining, and operating robust, reliable systems. This has led me to put a lot of time into researching, evaluating, and implementing different solutions for automatic failure detection, monitoring, and more recently, observability. Before we get started: What is observability?
NodeJS Application Manual Instrumentation for Distributed Traces
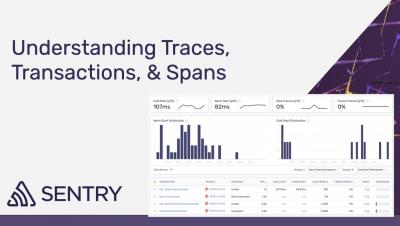
Understanding Traces, Transactions, and Spans
Using Jaeger for your microservices
Tracing Issues in Your Application
AppDynamics supports AWS Distro for OpenTelemetry (ADOT) general availability for traces 1.0
We're excited to help our customers further leverage the benefits of OpenTelemetry via integration with AWS Distro for OpenTelemetry (ADOT) for traces 1.0.
Getting Started with OpenTelemetry and VMware Tanzu Observability
Modern application architectures are complex, typically consisting of hundreds of distributed microservices implemented in different languages and by different teams. As a developer, SRE, or DevOps engineer, you are responsible for the reliability and performance of these complex systems. But while you might have metrics that will help you debug when there’s an issue, metrics alone can’t help you narrow down and ultimately identify the root cause.
observIQ Cloud and the OpenTelemetry Collector
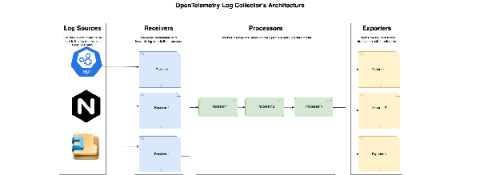
Our log agent is powerful, efficient, and highly adaptable. Now, with OpenTelemetry setting new standards in the observability space, we wanted to incorporate that collaboration into our log agent and offer our users the ability to take advantage of the OpenTelemetry ecosystem. Starting today, you can upgrade the log agents in your observIQ account to the new Open Telemetry-based observIQ log agent with a single click.


