Operations | Monitoring | ITSM | DevOps | Cloud

Analytics

Installing the ELK Stack on Alibaba Cloud: Step by Step Guide

The ELK Stack is the world’s most popular open source log analytics and log management platform. Together, the four main components of the stack — Elasticsearch, Logstash, Kibana and Beats, provide users with a powerful tool for aggregating, storing and analyzing log data. In production environments, the ELK Stack requires an infrastructure flexible and powerful enough to power it.

5 Splunk Alternatives - Faster, Affordable Log Management Solutions

Learn the best Splunk alternative, what to look for in alternative solutions, and other factors like logging features, speed, ease of use, deployment, scalability, and cost.What Does Splunk Do?Since its first release in 2007, Splunk quickly became one of the leading log management solutions. Its focus on enterprise grade log analysis and security incident and event management (SIEM) made it the de facto choice for organizations generating large volumes of log files and machine data.

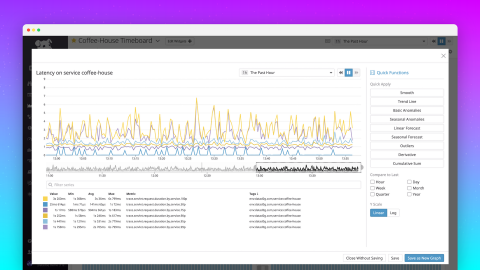
Explore your data in full-screen graph mode

As you navigate through Datadog, you may find that you want to dive into a graph to explore your timeseries data more deeply, or make quick changes to a graph without permanently altering it. To make it easier to explore the data in your graphs, we’re excited to introduce a newly revamped full-screen view for our timeseries graphs. You can now quickly and easily apply functions, navigate through time to find anomalies, and save and share your work.

Metricbeat vs. Telegraf: Side-by-Side Comparison

Responsible for collecting various system and service metrics and forwarding them downstream to a backend storage system, the role metric collectors play in monitoring pipelines is crucial. Despite this fact, they often get left in the shadows cast by the beautiful frontend analysis tools like Kibana or Grafana. In the world of open source monitoring stacks, Metricbeat and Telegraf stand out as the most popular metric collectors. The truth is that they do much more than simply collect metrics.

How to Monitor Activity in Your IBM Cloud with LogDNA

Cloud environments are becoming increasingly complex, with applications and even infrastructures changing constantly. Despite their dynamic nature, these environments must be monitored constantly for teams to ensure the stability, security, and performance of workloads running in them. Tracking these infrastructure changes is one of the most important—and one of the most difficult—parts of maintaining a cloud environment.

How to Defend Your Business Against SQL Injections

One of the oldest (but often neglected) security vulnerabilities is SQL injection. One common scenario goes like this: An unsuspecting programmer writes an application that accepts input from the user which serves as a parameter to retrieve or store data from a database (e.g., a web login form). The programmer writes a dynamically populated SQL query inside the app, based on user input like username and password (see Image 1 for reference).

Deploying Elasticsearch in GKE with Elastic Cloud on Kubernetes

Dan Roscigno from Elastic will show you how to get started - from deploying a k8s cluster in GKE, to deploying the ECK Kubernetes Operator, and then deploying Elasticsearch and Kibana. After launching Kibana and enabling monitoring you will see the Elasticsearch cluster scale from one to three nodes.