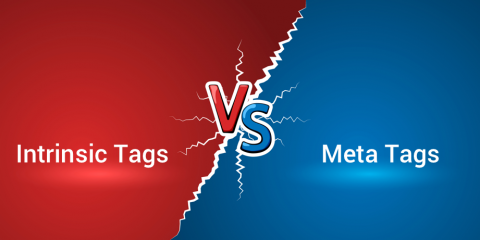
Intrinsic vs Meta Tags: What's the Difference and Why Does it Matter?
Tag-based metrics are typically used by IT operations and DevOps teams to make it easier to design and scale their systems. Tags help you to make sense of metrics by allowing you to filter on things like host, cluster, services, etc. However, knowing which tags to use, and when, can be confusing. For instance, have you ever wondered about the difference between intrinsic tags (or dimensions) and meta tags with respect to custom application metrics? If so, you’re not alone.