Predictive IT with Splunk IT Service Intelligence
Learn about the predictive analytics capabilities of Splunk IT Service Intelligence and the value it can bring IT and the business, helping you shift from reactive to predictive IT.


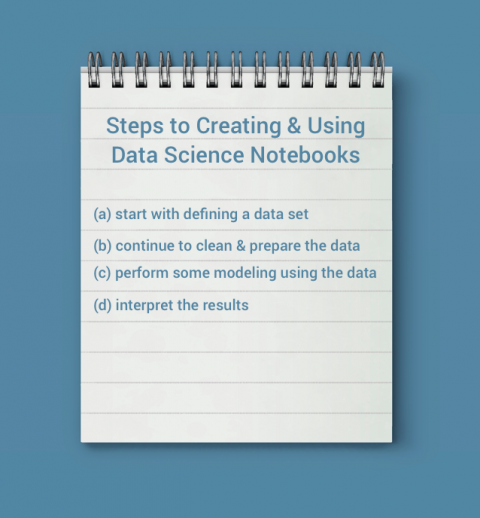
This year, at Sumo Logic’s third annual user conference, Illuminate 2018, we presented Sumo Logic Notebooks as a way to do data science in Sumo Logic. Sumo Logic Notebooks are an experimental feature that integrate Sumo Logic, notebooks and common machine learning frameworks. They are a bold attempt to go beyond what the current Sumo Logic product has to offer and enable a data science workflow leveraging our core platform.
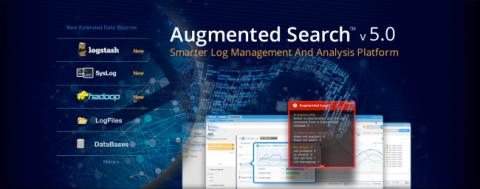
ITOA becomes very manageable and simple with XpoLog log management tool. This post will focus on methods the team here at XpoLog uses to manage unstructured IT log data and visualization using smart tagging techniques.
This week at the Microsoft Ignite, we unveiled two new Sumo Logic applications for Microsoft Azure services — Azure SQL Database and Azure Active Directory — and two new native integrations with Azure Monitor and Blob Storage. As a cloud-native company, our goal at Sumo Logic is to give our customers the flexibility to create digital IT and DevOps initiatives that leverage multi-cloud deployments in Amazon Web Services (AWS), Google Cloud Platform (GCP) and Microsoft Azure.
This week we share articles covering Grafana’s alpha Explore UI, the many ways Logicify uses Grafana, building your own centralized monitoring stack, and more.