What is Retrace Application Performance Monitoring (APM)?
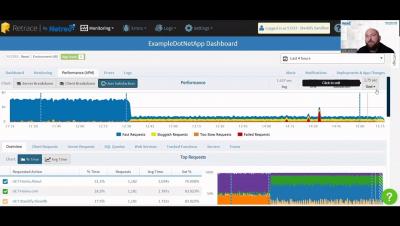
Retrace is so much more than your average Application Performance Monitoring tool; and the more you know about the tools and capabilities at your disposal, the easier it is to keep application performance humming. In this Retrace overview video, Stackify by Netreo Customer Success Lead Kyle Jackson shares valuable insights into how and why Retrace works the way it does, and the powerful monitoring capabilities that help you improve the performance of your applications.